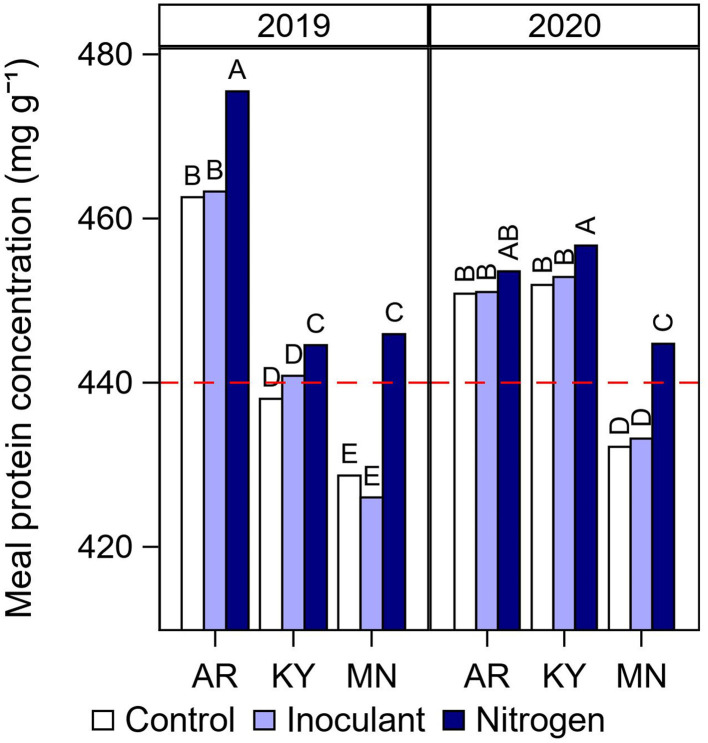
Figure 5.
Summary of interactive effects of cultural practices on meal protein concentration. Meal protein concentration by late-season input treatment (Control, Inoculant application at R3, and N fertilizer applications after R5) at each year and location. Data averaged across rotation types and cultivars. Different letters above bars within a year indicate significantly different means at P < 0.05. The red dashed line indicates the minimum protein concentration threshold in non-dehulled soybean meal required by the processing industry for high protein meal designation.

