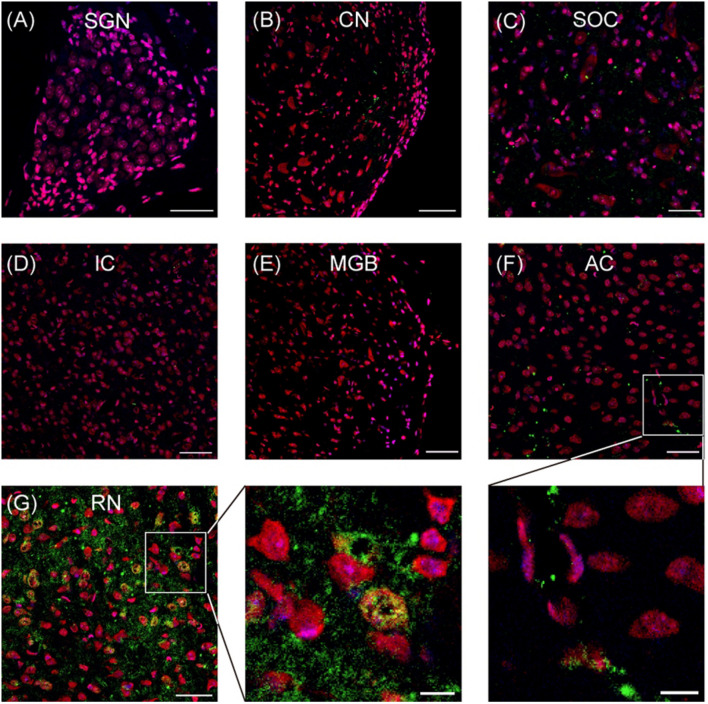
FIGURE 1.
Representative images show the serotonin transporter (SERT) expression in different regions of auditory system. (A–G) Confocal images show the SERT (green) expression in the spiral ganglion neurons (SGN), cochlear nuclei (CN), superior olivary complex (SOC), inferior colliculus (IC), medial geniculate body (MGB), auditory cortex (AC), and raphe nuclear complex (RN). Insets are the magnified images of the boxes in (F,G). The soma and nucleus of neurons are colored in red (Nissl) and blue (DAPI), respectively. SERT is colored in green. Scale bars: 50 μm for (A–G) and 10 μm for insets.

