Figure 8.
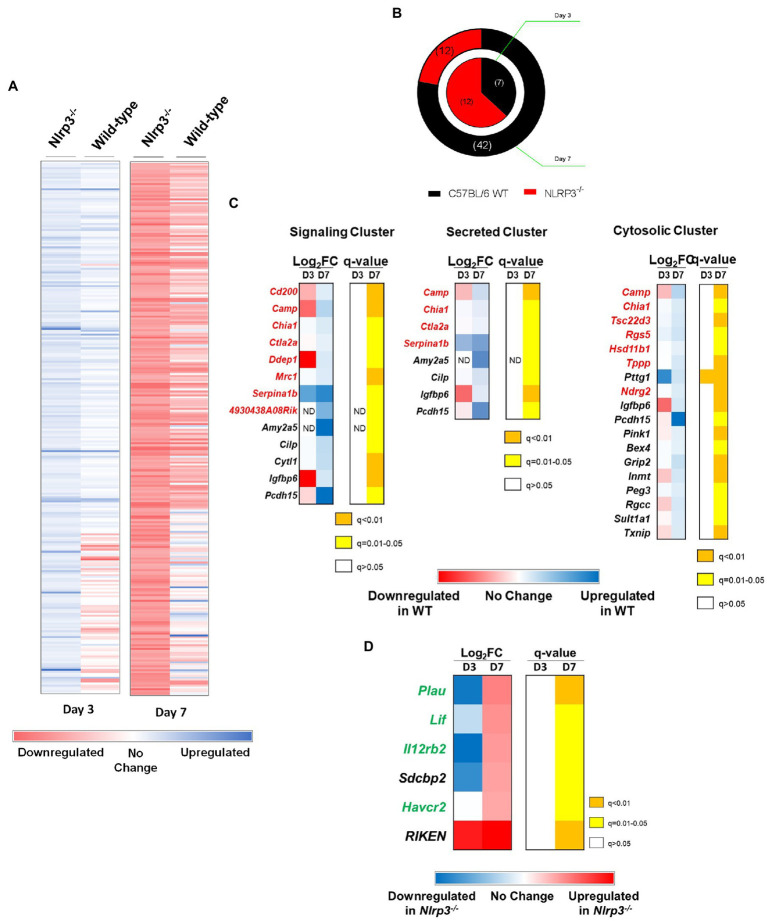
Genes known to enhance the host’s susceptibility to F. tularensis infection are downregulated in Nlrp3−/− mice. Wild-type and Nlrp3−/− mice were infected intranasally with 1×10⁴CFU of F. tularensis LVS. Total RNA was isolated from lungs of infected mice on days 3 and 7 post-infection and sequenced to determine the expression of various genes in the mouse by RNA-sequencing. The genes were aligned and their expression profile over time has been represented as a heat map of the Log2Fold change. (A) Expression profile of genes that were significantly differentially expressed (q<0.05) in wild-type and Nlrp3−/− mice. (B) Pie chart representing significantly expressed genes between wild-type and Nlrp3−/− mice. The inner ring represents the expression profile of the indicated mouse strain on day 3, while the outer ring represents the expression profile on day 7 post-infection. The numbers of differentially expressed genes are shown in the parenthesis. (C) DAVID genomics and clusters based on functional annotation of genes in F. tularensis LVS-infected wild-type and Nlrp3−/− mice on day 3 and 7 post-infection. (D) Differential expression of genes in Nlrp3−/− mice known to have a protective role against F. tularensis infection. The expression profile is presented as heat maps alongside corresponding q values. Genes in red font are known to enhance the susceptibility of the host to F. tularensis, while those in green have a protective role. Data shown are cumulative of transcript levels using RNA isolated from lungs of F. tularensis-infected mice (n=3/time point/group) on days 3 and 7 post-infection.

