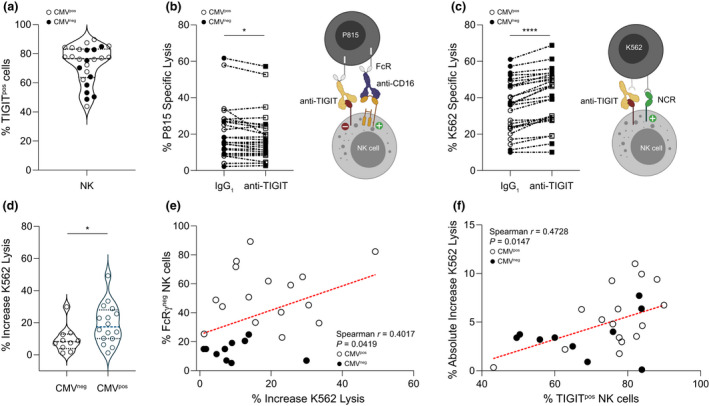
Figure 4.

Impact of TIGIT engagement on NK cell CD16‐mediated and natural cytotoxicity. (a) The range of TIGIT expression on NK cells (49.8−90.0%) from PLWH selected for functional studies is depicted (median ± IQR 76.6 ± 19.6%). (b) NK cells were triggered to lyse P815 cells using anti‐CD16, and the overall effect of NK cell TIGIT cross‐linking was measured using IgG1 isotype control (not depicted) or anti‐TIGIT (represented by the yellow antibody). Percent specific lysis of P815 cells mediated through CD16 with either IgG1 or anti‐TIGIT was compared. Wilcoxon signed‐rank test *P = 0.0351. (c) NK cells were pretreated with anti‐TIGIT to prevent interaction with PVR on K562 cells, and lysis was measured and compared with lysis mediated by NK cells pretreated with IgG1. Student's paired t‐test ****P < 0.0001. Percent increase in NK cell cytotoxicity against K562 targets in the presence of anti‐TIGIT vs IgG1 was calculated from raw data in (c) and compared between (d) groups distinguished by CMV serostatus (Mann–Whitney U‐test *P = 0.0309) and (e) correlated with percentage of FcRγ– NK cells. (f) Absolute increase in NK cell lysis of K562 cells in the presence of anti‐TIGIT mAb was correlated with the percentage of TIGIT+ NK cells. For all graphs, filled symbols represent CMV‐seronegative (n = 10) participants, and open symbols depict CMV‐seropositive participants (n = 16). Horizontal lines bisecting groups in a and d represent median with IQR.
