
Figure 5.
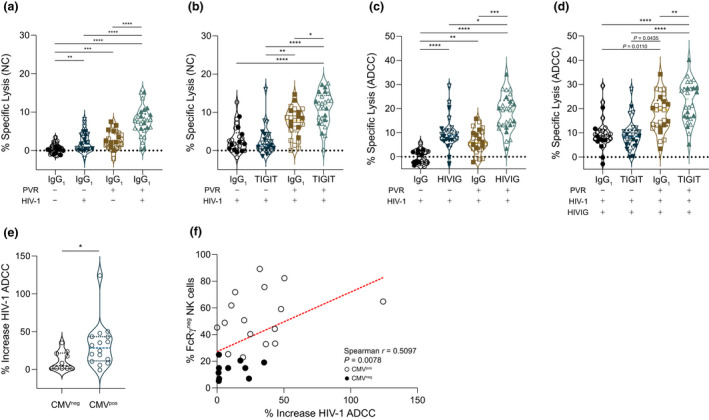
Impact of TIGIT blockade on natural and antibody‐dependent NK cell‐mediated cytotoxicity. Cytotoxicity experiments were performed over 5 h with PBMC from PLWH and uninfected or HIV‐1 A17‐infected CEM.NKR‐CCR5 or CEM.NKR‐CCR5 PVR+ target cells. (a) Natural cytotoxicity (NC) in the absence (−) or presence (+) of PVR was measured against uninfected (−) or HIV‐1 infected (+) targets. One‐way ANOVA with Tukey's multiple comparison **P = 0.0071 ***P = 0.0006 ****P < 0.0001. (b) PBMC pre‐incubated with control IgG1 or anti‐TIGIT mAb were tested for NK cell‐mediated killing against HIV‐1 A17‐infected CEM.NKR‐CCR5 or CEM.NKR‐CCR5 PVR+ targets. Nonparametric ANOVA with Dunn's multiple comparison *P = 0.0158 **P = 0.0035 ****P < 0.0001. (c) Control IgG or HIVIG was used to elicit ADCC against HIV‐1 A17‐infected targets with or without PVR and cytotoxicity was measured. Nonparametric ANOVA with Dunn's multiple comparison *P = 0.0158 **P = 0.0016 ***P = 0.0002 ****P < 0.0001. (d) PBMC were pretreated with control IgG1 or anti‐TIGIT mAb, and the effect of TIGIT blockade on NK cell HIV‐1‐specific ADCC was measured against HIV‐1 A17‐infected CEM.NKR‐CCR5 or CEM.NKR‐CCR5 PVR+ cells in the presence of HIVIG. Nonparametric ANOVA with Dunn's multiple comparison **P = 0.0076 ****P < 0.0001. (e) Percent increase in NK cell cytotoxicity against CEM.NKR‐CCR5 PVR+ targets in the presence of HIVIG and anti‐TIGIT vs IgG1 was calculated from raw data in d and compared between (e) groups distinguished by CMV serostatus (Mann–Whitney U‐test *P = 0.0198) and (f) correlated with the percentage of FcRγ– NK cells. For all graphs, filled symbols represent CMV‐seronegative (n = 10) participants, and open symbols represent CMV‐seropositive participants (n = 16). Horizontal lines bisecting groups represent median with IQR.