Figure 6.

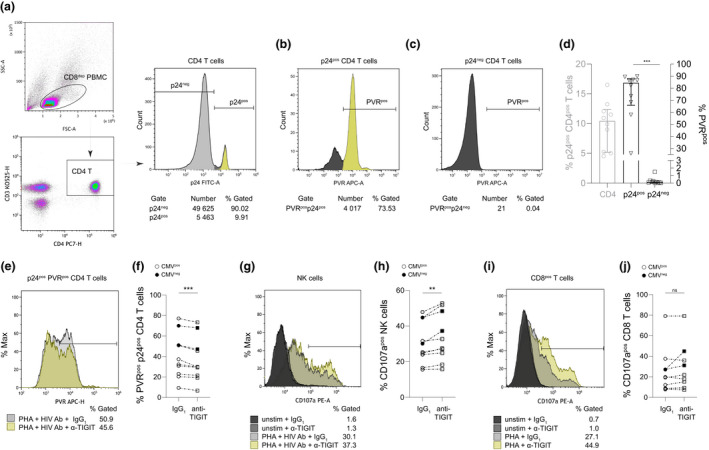
Effect of TIGIT blockade on HIV‐1‐specific NK cell and CD8+ T‐cell activation and elimination of endogenously infected PVR‐expressing CD4+ T cells ex vivo. (a) PBMC from PLWH were depleted of CD8+ T cells, treated with IL‐2 and assessed for HIV‐1 infection by p24 expression. Representative plots depict initial gating on CD3+CD4+CD8dep lymphocytes and determination of the percentage of PVR expression for (b) p24+ or (c) p24‐ cells. (d) Summary data as in a–c from 10 individuals. The left axis depicts percentage of CD4+ T cells that were p24+ 72–144 h after CD8+ T‐cell depletion, and the right axis represents the percentage of PVR expressing cells in either the p24+ or p24− CD4+ T‐cell populations. ANOVA with Tukey's multiple comparison ***P = 0.0001. Error bars in d represent median with IQR. Following 72 h PHA‐P activation of PBMC, (e, f) loss of p24+PVR+CD4+ T cells or (g, h) NK cell and (i, j) CD8+ T‐cell degranulation was evaluated 24 h after treatment with either IgG1 or anti‐TIGIT mAb in the presence of anti‐HIV‐1 antibodies. Histogram plots for each analysis are depicted in e, g, i with data summarised for 10 participants in f, h, j. Degranulation was assessed after gating on lymphocytes and enumerating CD107a‐expressing cells in either CD3‐CD56+ (NK cell) or CD3+CD8+ (CD8+ T cell) populations. P‐values in f, h, j were calculated using the Student's paired t‐test **P = 0.0034 ***P = 0.0007.
