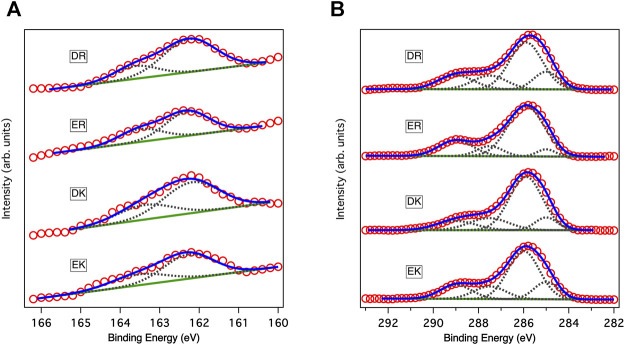
FIGURE 1.
XP spectra of peptide-SAMs in (A) C1s and (B) S2p regions. Red circles, solid blue lines, solid green lines, and gray dotted lines show data points in the spectra, fitting results, backgrounds, and deconvoluted spectra, respectively. In fitting the spectra in the S2p region, the ratio between the two states and the splitting gap were kept at 2:1 and 1.2 eV, respectively.

