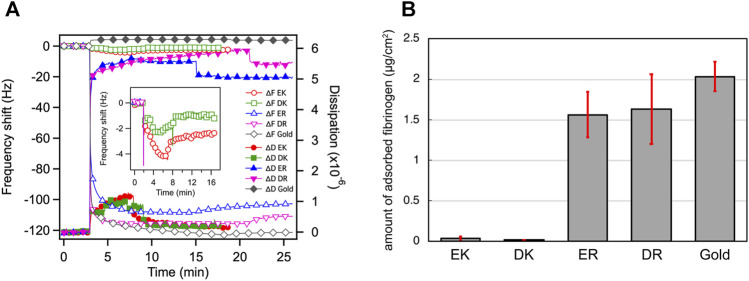
FIGURE 2.
(A) QCM chart (frequency and dissipation) observed for adsorption of fibrinogen onto the peptide-SAMs. Rinsing with PBS were performed at 8, 9, 15, 21, 17 min for EK, DK, ER, DR, and bare gold, respectively. (B) The amount of adsorbed fibrinogen on peptide-SAMs in the PBS solution measured by QCM-D. Error bars denote standard deviation (n = 3).

