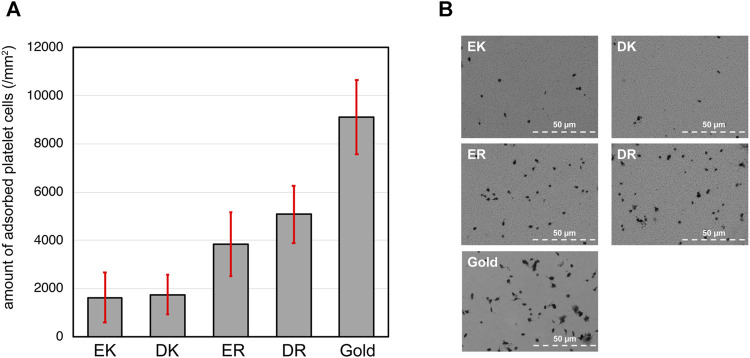
FIGURE 3.
(A) The density of adhered platelet cells on peptide-SAMs and gold surface. Error bars denote standard deviation (n = 45). (B) Representative SEM images of the adhered platelet cells on the peptide-SAMs and the gold surface. Note that the particles smaller than the platelets are gold clusters formed after the deposition of gold to enhance the conductivity for SEM imaging.

