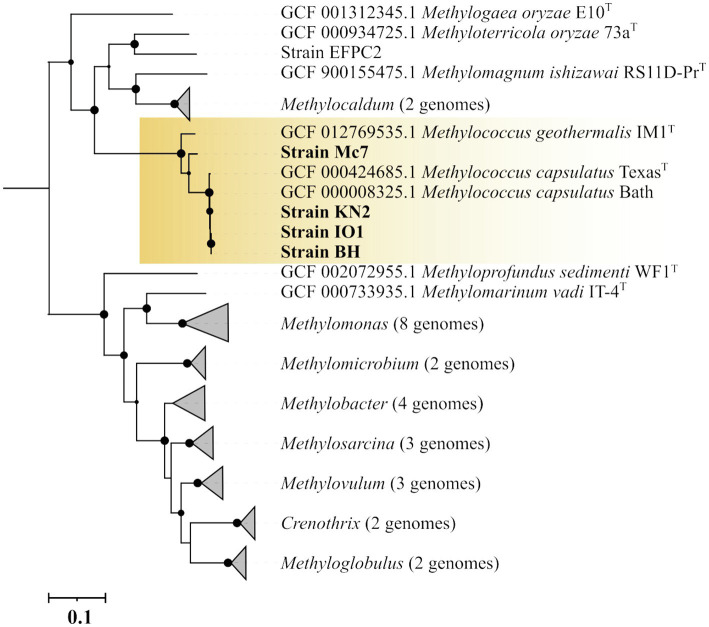
Figure 3.
Genome-based phylogeny showing the position of new isolates in relation to other gammaproteobacterial methanotrophs based on the comparative sequence analysis of 120 ubiquitous single-copy proteins. The clade of Methylococcus methanotrophs is highlighted by orange. The tree was constructed using the Genome Taxonomy Database toolkit (Parks et al., 2018), release 04-RS89. The significance levels of interior branch points obtained in maximum-likelihood analysis were determined by bootstrap analysis (100 data re-samplings). Bootstrap values of >70% are shown. The root (not shown) is composed of all genomes available in GTDB for methanotrophs of the genera Methylosinus and Methylocystis. Bar, 0.1 substitutions per amino acid position.

