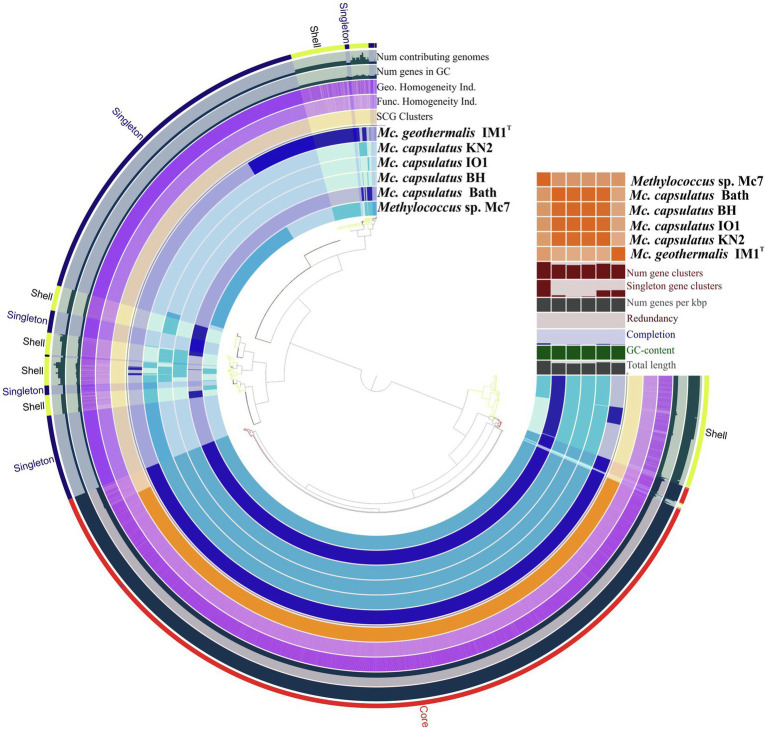
Figure 6.
Pan-genome analysis. Clustering of genomes based on the presence/absence patterns of 4,485 pan-genomic clusters. The genomes are organized in radial layers as core, singleton, and shell gene clusters (Euclidean distance; Ward linkage) which are defined by the gene tree in the center. Genomes of new isolates are colored by blue. Genomes of Methylococcus capsulatus Bath and Methylococcus geothermalis IM1T are colored by dark blue. Line segments indicate single gene clusters. The outermost circles carry the information regarding the number of genomes containing specific gene cluster, number of genes in gene clusters (gray), functional, geometric, and combined homogeneity indexes (purple), distribution of single-copy gene clusters (orange circle). The layers below the heatmap display from the bottom to top: total length of the genomes, GC content, genomes completion, redundancy of each genome, number of genes per kbp, number of singleton gene clusters, total number of gene clusters. Heatmap denotes correlation between the genomes based on average nucleotide identity values calculated using pyANI.

