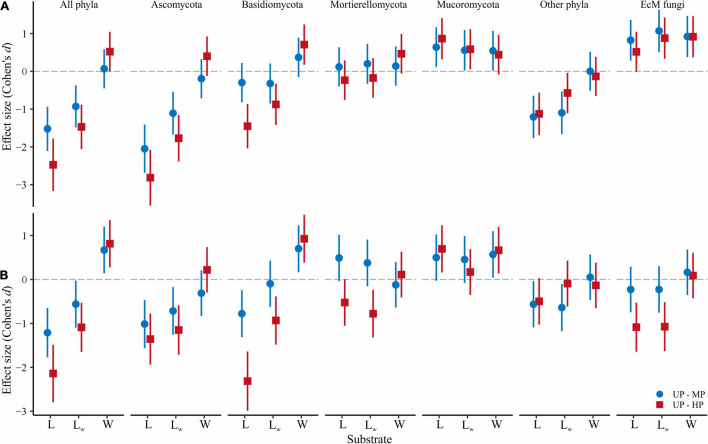
FIGURE 3.
Pollution-induced changes in (A) OTU richness and (B) effective number of OTUs in MP (circles) and HP area (squares) within three types of forest detritus (L, CWD-uninfluenced litter CWD; LW, CWD-influenced litter; W, wood). The negative effect size indicates a pollution-induced decrease of fungal diversity compared with the UP area, positive effect size – diversity increase. Median and 95% CI are shown. OTU, operational taxonomic unit; MP, moderately polluted; HP, heavily polluted; CWD, coarse woody debris; UP, unpolluted.

