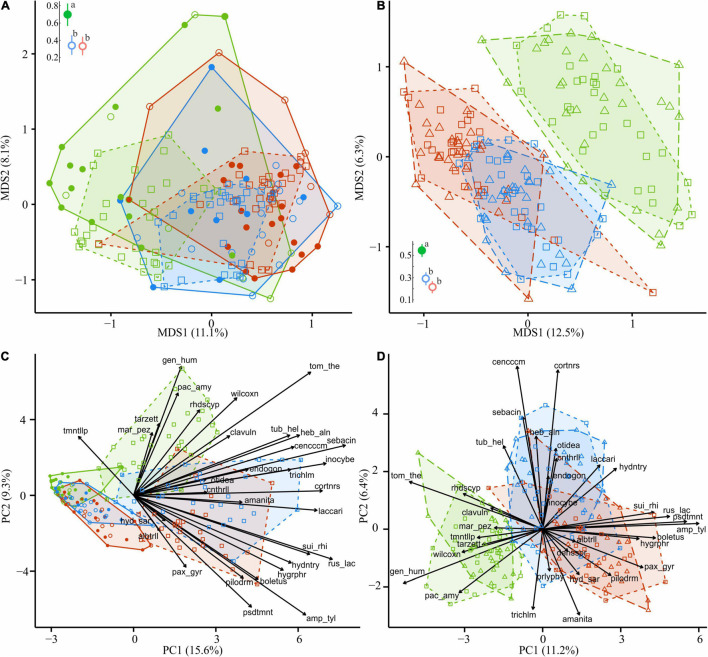
FIGURE 8.
Compositional dissimilarity of EcM fungi from the areas with different levels of industrial pollution (green, UP area; blue, MP area; red, HP area). Filled circles in (A,C) denote fir wood; empty circles, spruce wood. Triangles in (B,D) denote CWD-influenced litter. CWD-uninfluenced litter is shown with squares. Average dissimilarity values with 95% CI are shown next to ordination diagrams in (A,B) filled dots indicate statistically significant compositional divergence between microhabitats within an area (PERMANOVA test, p < 0.05); different letters indicate significant effect of area on dissimilarity (Tukey’s test, p < 0.05). The arrows indicate the increase in EcM lineage relative abundance toward an area and a substrate. EcM, ectomycorrhizal; UP, unpolluted; MP, moderately polluted; HP, heavily polluted; CWD, coarse woody debris.

