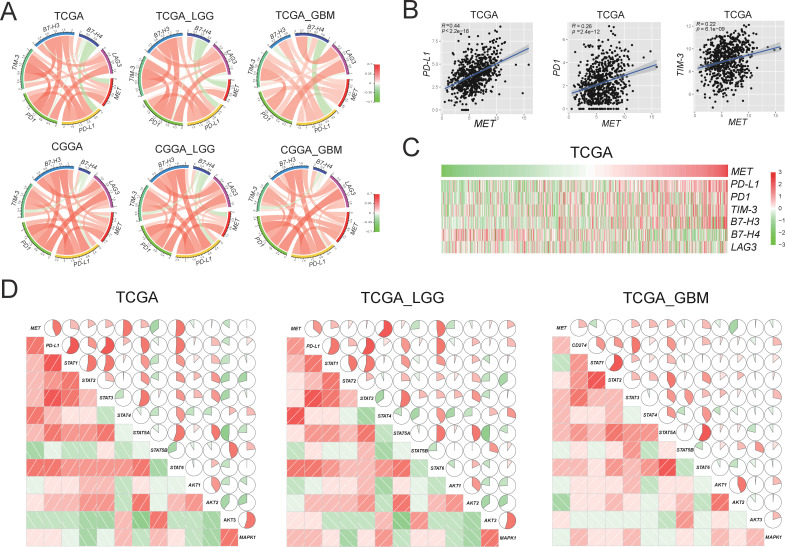
Figure 1.
Correlation between MET and immune checkpoints in RNA expression level in primary gliomas. (A) MET expression is positively associated with expression of PD-L1 in TCGA and CGGA data sets. (B) The scatter diagrams show the coexpression patterns of MET and PD-L1/PD1/TIM-3. (C) With the increase of MET expression, the expression of PD-L1 increased gradually. (D) MET/PD-L1 expression positively correlated with STAT pathway in the TCGA data set. Corrgrams are derived according to Pearson’s r value between MET/PD-L1 and three pathways (STAT, AKT, and MAPK). In both the lower shade charts and the upper pie charts, positive correlations are displayed in red and negative correlations in green. Color intensity and the size of the circle are proportional to the correlation coefficients. CGGA, Chinese Glioma Genome Atlas; GBM, glioblastoma; LGG, lower grade glioma; MET, mesenchymal-epidermal transition factor; PD1, programmed cell death protein 1; PD-L1, programmed death-ligand 1; TCGA, The Cancer Genome Atlas; STAT, signal transducer and activator of transcription; AKT, protein kinase B; MAPK, mitogen-activated protein kinase.

