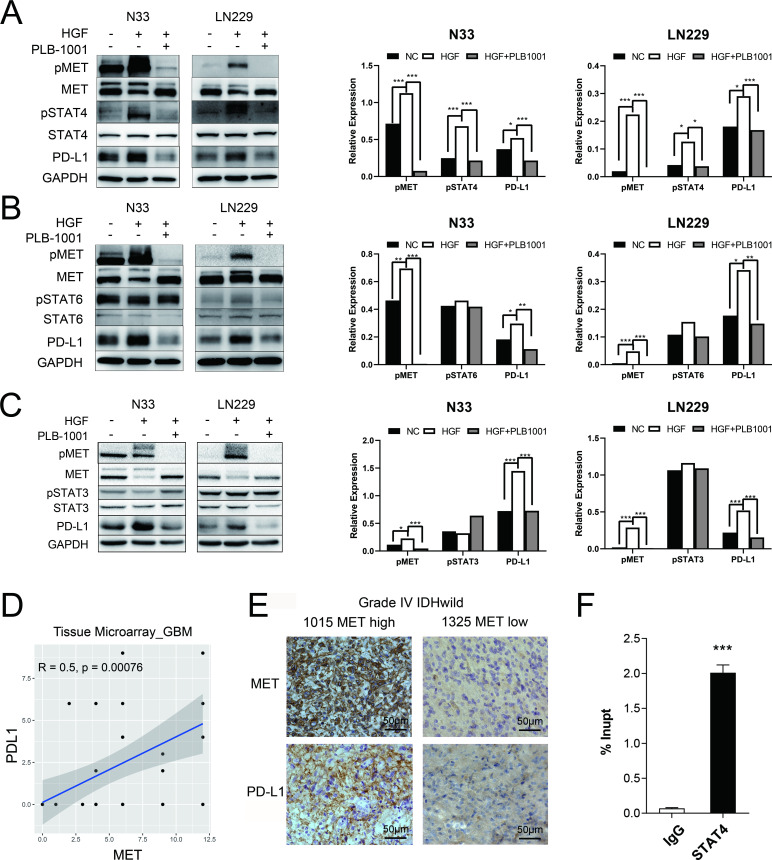
Figure 2.
MET triggered an increase in PD-L1 protein expression through STAT4 pathway. (A–C) Western blot of the indicated proteins in N33 and LN229 cell lines on treatment with HGF (200 ng/mL), and HGF/PLB-1001 (100 µM) combined, for 24 hours. GAPDH, protein-loading controls. Quantitative results of western blot analysis and relative expression difference are shown on the right panel. Fisher’s exact test, *p<0.05, **p<0.01, ***p<0.001. (D) In the IHC analysis of the tissue microarray, the scatter plot shows the correlation between the expression of MET and PD-L1 proteins in GBM. (E) Photographs of IHC staining of two representative WHO 4 (IDH-wildtype) primary glioma. Positive cells are stained brown. Magnification, 400×. (F) The statistical result of chromatin immunoprecipitation assay confirming the binding of STAT4 to the PD-L1 DNA. Student’s t-test, ***p<0.001. GAPDH, glyceraldehyde 3-phosphate dehydrogenase; GBM, glioblastoma; HGF, hepatocyte growth factor; IHC, immunohistochemistry; MET, mesenchymal-epidermal transition factor; PD-L1, programmed death-ligand 1; pMET, phosphorylated MET; pSTAT4, phosphorylated STAT, signal transducer and activator of transcription; PLB-1001, Bozitinib; NC, negative control.

