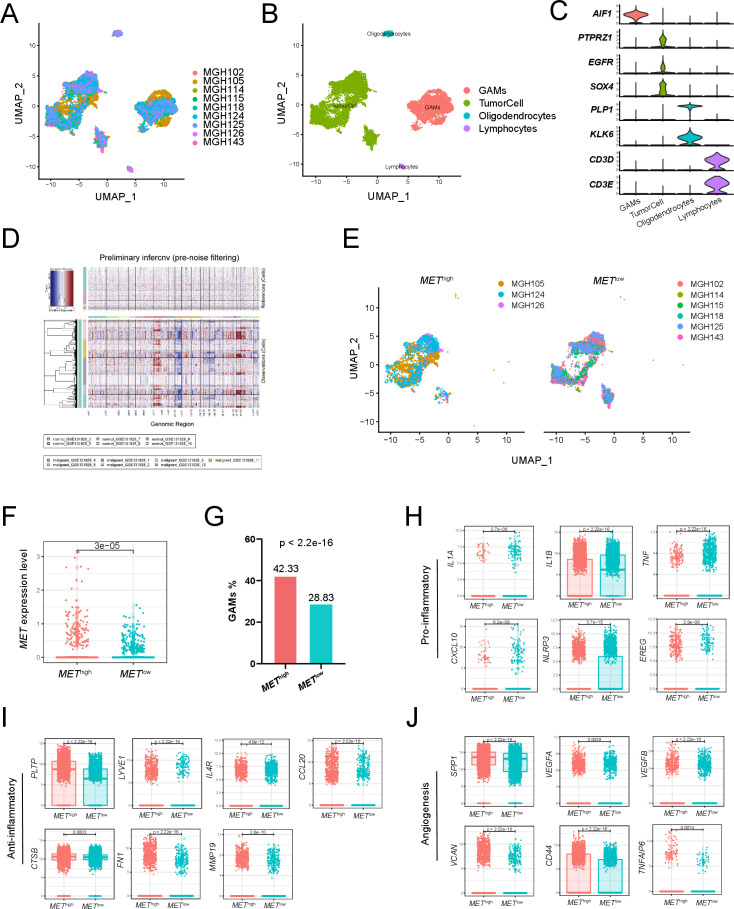
Figure 7.
Single-cell transcriptome analysis of primary IDH-wildtype GBM. Two-dimensional UMAP shows dimensional reduction of data from single cells. (A) Nine samples are integrated and cells from each sample are differently colored. (B) Cells from nine samples are clustered into four groups including GAMs. (C) The violin plots show the expression of marker genes for the four groups of cells. (D) Nine samples are integrated for InferCNV analysis. The upper part of the heatmap shows the normal cells and the lower part shows the malignant cells. The red and blue colors refer to gains or deletions of chromosomes, respectively. (E) The UMAP plot shows tumor cells from the METhigh and METlow groups. (F) The boxplot shows the level of MET expression in tumor cells from the METhigh and METlow groups. (G) Proportion of GAMs in the METhigh group (42.33%) and the METlow group (28.83%). Expression of proinflammatory mediators (H), anti-inflammatory mediators (I), and angiogenesis-associated genes (J) in GAMs from the METhigh and METlow groups. GAMs, glioma-associated microglia, monocytes and macrophages; GBM, glioblastoma; MET, mesenchymal-epidermal transition factor; UMAP, uniform manifold approximation and projection.

