Figure 3.
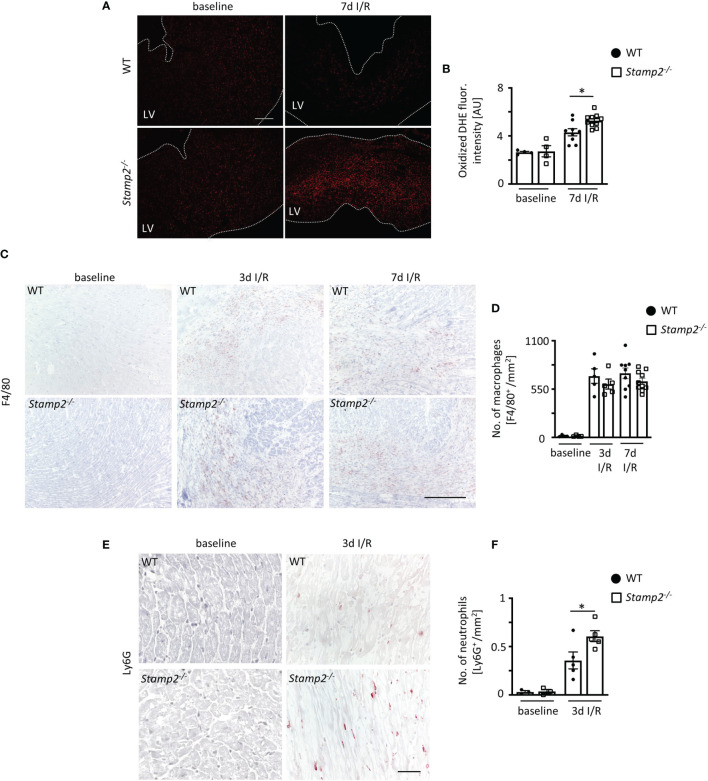
Stamp2 regulates myocardial PMN infiltration after I/R. (A) Representative stainings of oxidized dihydroethidium (DHE) and (B) quantitative analysis of ROS production in myocardial sections 7 days after I/R induction (n=4/4/7/8). Scale bar=200 μm. (C) Representative left ventricular immunohistological stainings for the pan-macrophage marker F4/80 (brown) and (D) quantitative analysis of macrophage numbers within the infarct region (n=4/4/5/5/9/10). Scale bar= 200 μm. (E) Representative left ventricular immunohistological stainings for the PMN marker Ly6G (brown) and (F) quantitative analysis of neutrophil numbers within the infarct region 3 days after I/R induction (n=3/3/5/5). Scale bar = 50 μm. Graphs show Mean ± SEM. Significance was determined by two-way ANOVA followed by Tukey post-hoc test. *P < 0.05.

