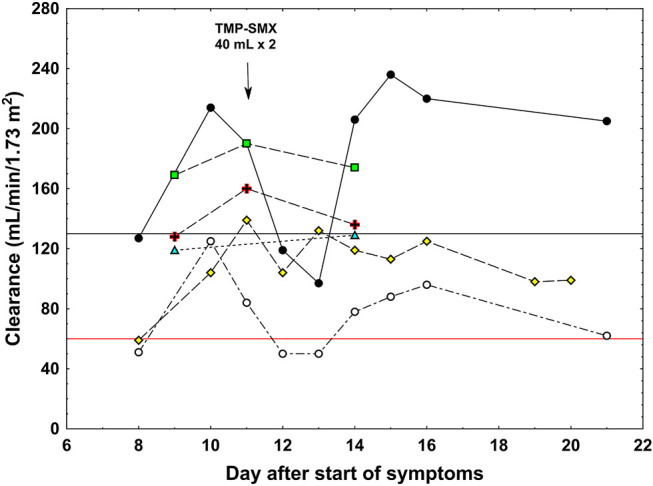
FIGURE 2.

Clearance values in a patient with augmented renal clearance. Black circles: measured creatinine clearance, white circles: measured urea clearance, green triangles: iohexol clearance, yellow rhomboids: cystatin C clearance, red cross: total vancomycin clearance, green squares: free vancomycin clearance. The black horizontal line shows the limit for augmented renal clearance (130 ml/min/1.73 m2) and the red horizontal line shows the upper normal reference for urea clearance (60 ml/min/1.73 m2). Arrow shows the dosage of trimethoprim–sulfamethoxazole (TMP-SMX).
