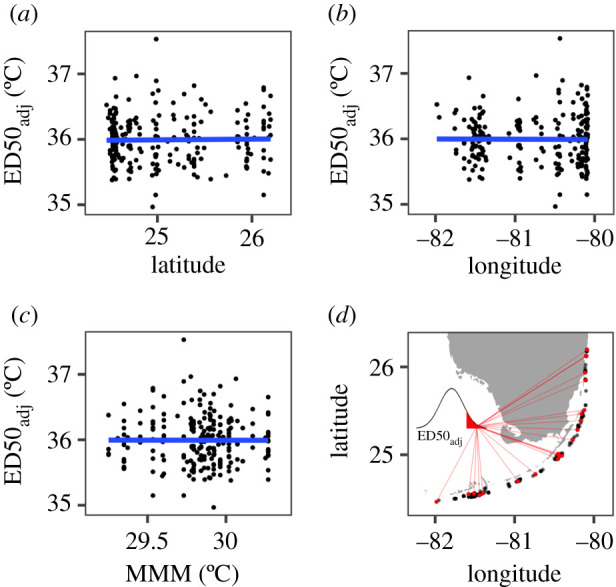
Figure 3.

Relationship between thermal tolerance and source colony location and temperature regime. Adjusted ED50 values for nursery corals (controlling for environmental differences among nurseries) are plotted against (a) the original source colony latitude and (b) longitude, and (c) the corresponding maximum monthly mean (MMM) temperatures calculated from satellite SST data with 5 km resolution. Lines represent linear model fits; none of these slopes were significantly different from zero. (d) The most thermally tolerant colonies (top 10% of ED50adj, shown by inset) were sourced from throughout the wider population, as indicated by red line segments and points. All source colonies (except two from Dry Tortugas) are shown by black points along Florida's coral reef. (Online version in colour.)
