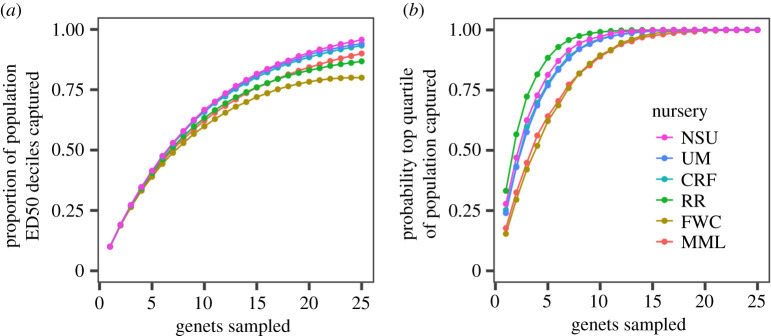
Figure 4.
Thermal tolerance phenotypes captured by randomly selecting genets from each nursery. (a) The proportion of adjusted ED50 deciles for the wider population captured in a random sample of n genets from each nursery. (b) The probability that a random sample of n genets from each nursery contains any of the top 25% most thermally tolerant genets across the wider population. (Online version in colour.)

