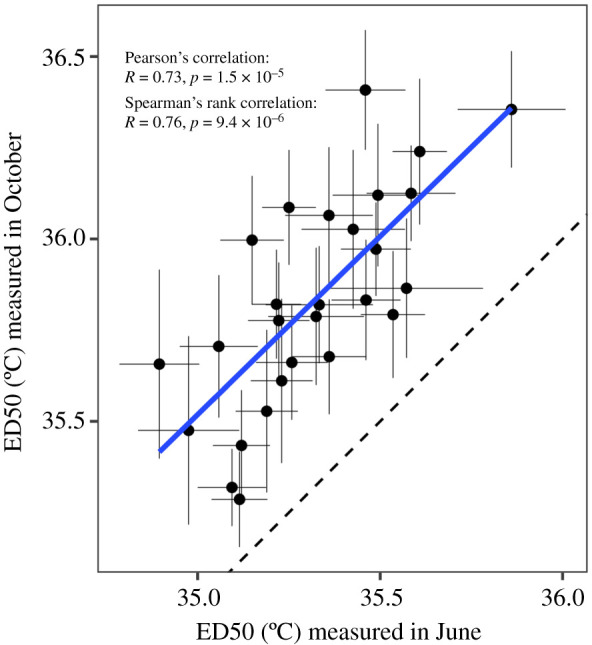
Figure 5.

Correlation between independent CBASS runs on the same coral genets sourced from the same nurseries. ED50 values measured in October are plotted against ED50 values measured in June (n = 27 genets). Error bars indicate the fitted parameter standard error. The solid line indicates a linear model fit (slope = 0.98), while the dashed line indicates unity (y = x). (Online version in colour.)
