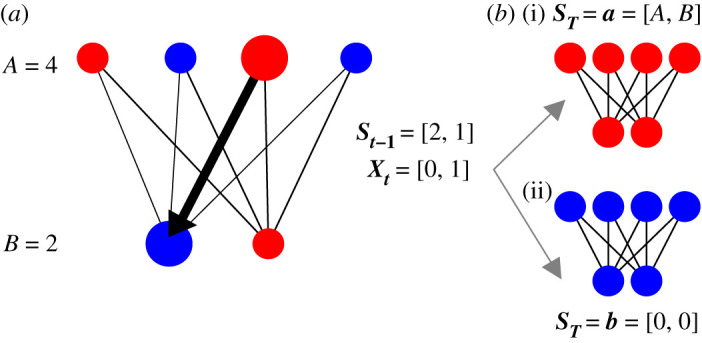
Figure 1.

Schematic of the Moran process on a bipartite graph and our notation. The complete bipartite graph constrains the offspring of individuals in group A to replace individuals in group B, and vice versa. This constraint is illustrated by the black lines. All individuals are either mutants (red) or residents (blue). St−1 is the number of mutants in each partition on time step t − 1, and Xt is the change in the process on time step t. On this example time step, the offspring of a mutant from A replaces a resident in B (enlarged individuals and thick arrow). We repeat the Moran birth–death process until all individuals are mutants (i) or residents (ii). a and b represent the two possible final states of ST.
