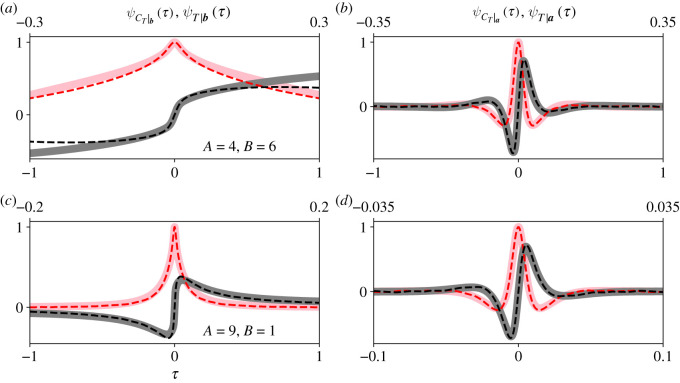
Figure 7.
Our CCFs of CT approximate those of T when the population size is small and selection is weak, or when partition sizes are asymmetric. (solid traces, a,c) and (solid traces, b,d) approximate ψT|b(τ) (dashed traces, a,c) and ψT|a(τ) (dashed traces, b,d) to within a scaling constant. We obtained ψT|b(τ) and ψT|a(τ) from 200 000 simulations. In all panels, and are plotted with respect to the bottom x-axis, and ψT|b(τ) and ψT|a(τ) are plotted with respect to the top x-axis. The real (pink and red) and imaginary (grey and black) parts of the CCFs are plotted separately. Note that, when the partition sizes are highly asymmetric (c,d), both the fixation and extinction CCFs closely match each other to within a scaling constant. When the partition sizes are approximately equal (a,b), the higher-order moments of CT|b do not approximate those of T|b as accurately. These observations are analogous to those made for the fully connected Moran process [16]. In all plots, r = 1.01, Sa,0 = 1 and Sb,0 = 0.

