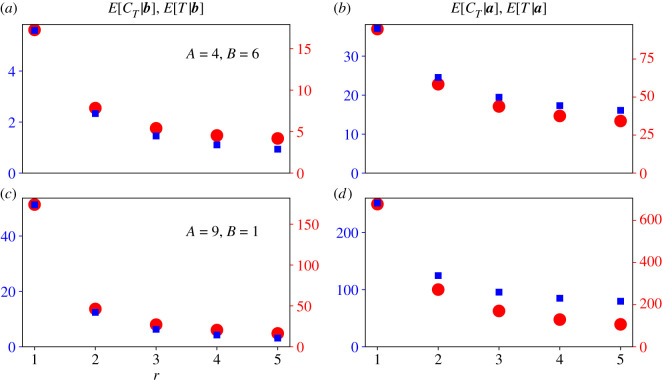
Figure 9.
The relationship between the conditional means of CT and T is complicated. We ran 100 000 simulations of the Moran process for five values of r, and for two bipartite graphs with the stated partition sizes A and B (a,b and c,d). We calculated the conditional means of CT (blue squares) and T (red circles) of those simulations, conditional on extinction (a,c) or fixation (b,d). Blue squares are plotted against the left blue y-axis, and red circles are plotted against the right red y-axis. If the conditional means of CT and T were proportional to each other, then the red and blue data points would perfectly overlap. But the relationship between CT and T varies over transient states of the Moran process, which is why its conditional time distributions are hard to calculate. That relationship also depends on r, the bipartite graph’s partition sizes, and whether the mutant population fixes or goes extinct. In all plots, Sa,0 = 1 and Sb,0 = 0.

