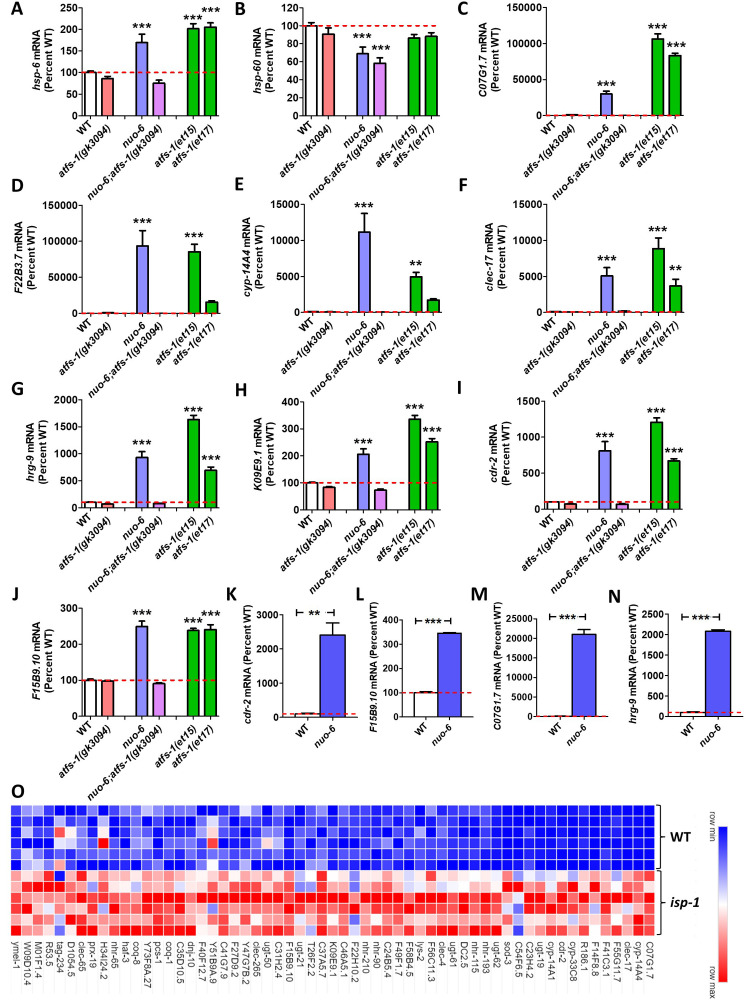
Figure 1. Levels of gene expression under conditions of mitoUPR activation.
To compare the efficacy of using different target genes to monitor activation of the mitoUPR, we examined the expression of each gene under conditions of ATFS-1 activation. To activate ATFS-1, we used a nuo-6 mutation (blue bars) or the constitutively active atfs-1(et15) and atfs-1(et17) mutations (green bars). ATFS-1 activation was prevented using an atfs-1 deletion mutation gk3094 in wild-type and nuo-6 worms (red bars and purple bars, respectively). Expression is shown as a percentage of wild type worms (white bars). A. There is a significant increase in hsp-6 mRNA under conditions of ATFS-1 activation that is prevented by disruption of atfs-1. B. The levels of hsp-60 are not increased in nuo-6 mutants or either constitutively active atfs-1 mutants. C-F.The mitoUPR target genes C01G1.7, F22B3.7, cyp-14A4 and clec-17 exhibit a marked increased in expression under conditions of ATFS-1 activation with a magnitude much greater than hsp-6. G-J. The mitoUPR target genes hrg-9, K09E9.1, cdr-2 and F15B9.10 show a large increase in expression relative to their standard deviation under conditions of ATFS-1 activation. K-N. The expression of mitoUPR target genes cdr-2, F15B9.10, C07G1.7 and hrg-9 show increased expression in nuo-6 worms by quantitative RT-PCR. O. Heat map comparing the expression of identified mitoUPR target genes between wild-type and long-lived mitochondrial mutant isp-1 worms. All but 4 of the 61 genes are significantly upregulated in isp-1 mutants. Expression levels in panels A-J were determined from our previously published RNA sequencing data (Wu et al., 2018). Expression represents counts per million from six biological replicates that has been normalized to wild-type. Heat map was generated using our previously published RNA sequencing data (Senchuk et al., 2018). Error bars indicates SEM. **p<0.01, ***p<0.001. Statistical significance was assessed using a one-way ANOVA with Dunnett’s multiple comparison test, except in panels K-N where a student’s t-test was used.

