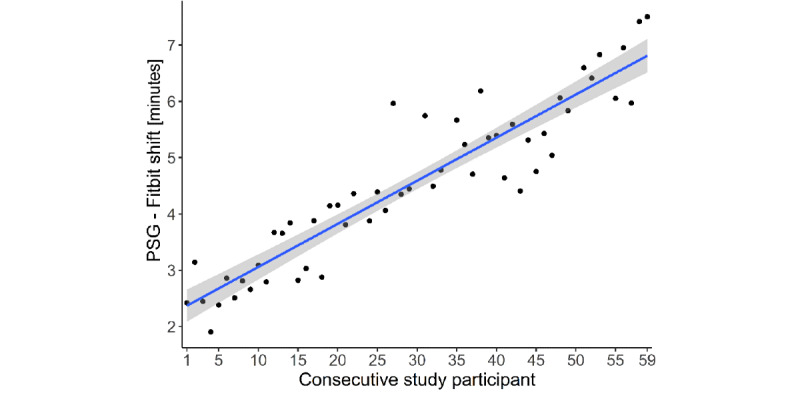
Figure 1.

The consecutive study participant numbers (higher numbers indicate chronologically later entry into the study) from the entire study sample are shown on the x-axis; the data-driven timeshift between polysomnography and Fitbit is shown on the y-axis. There was a significant linear relationship between the identifier and the shift (P<.001; adjusted R2=0.85). Thus, the times drifted apart as the study went on, with a minimum time misalignment of 1.9 minutes and a maximum of 7.5 minutes. PSG: polysomnography.
