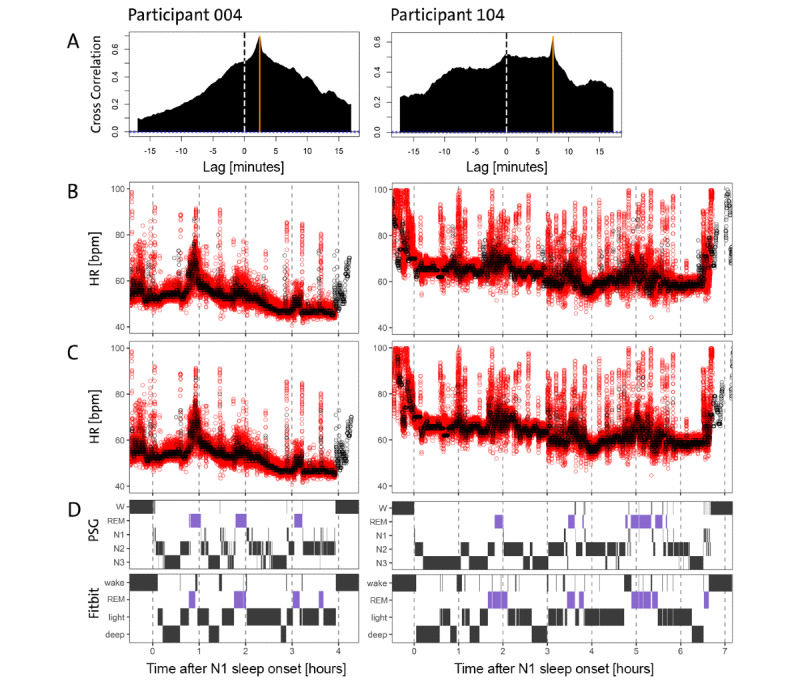
Figure 2.

Data on the validation night of the first participant in the study with identifying number 004 (left column) and the last participant in the study with number 104 (right column) are shown. Row A displays the cross-correlation function, which displays a large visible maximum at the orange vertical line representing the best alignment between the two devices (PSG and Fitbit). The dashed vertical reference line shows a lag of 0 minutes. Rows B-D share the same x-axis, which denotes hours after PSG-derived sleep onset with criteria. For each hour in the recording, a vertical dashed gray line was added. Row B shows the HR in bpm derived from PSG (red) and Fitbit (black) that were seen before any time alignment was applied, whereas row C presents the HR data after the data-driven shift from panel A was applied. The time-aligned time series visually shows good agreement after correcting for the time difference. Fitbit shows reduced variability in the signal but fairly good average correspondence. In panel D, the top row shows PSG-derived hypnograms for both participants, whereas in the bottom row, the Fitbit-derived hypnograms are displayed. All hypnograms have been time-corrected according to panel A. The overall sleep structure is captured reasonably well by Fitbit, but Fitbit detects more wake and REM episodes compared with PSG, and the distinction of light (N1+N2) and deep (N3) sleep often seems to be particularly challenging for Fitbit. bpm: beats per minute; HR: heart rate; PSG: polysomnography; REM: rapid eye movement; W: wake.
