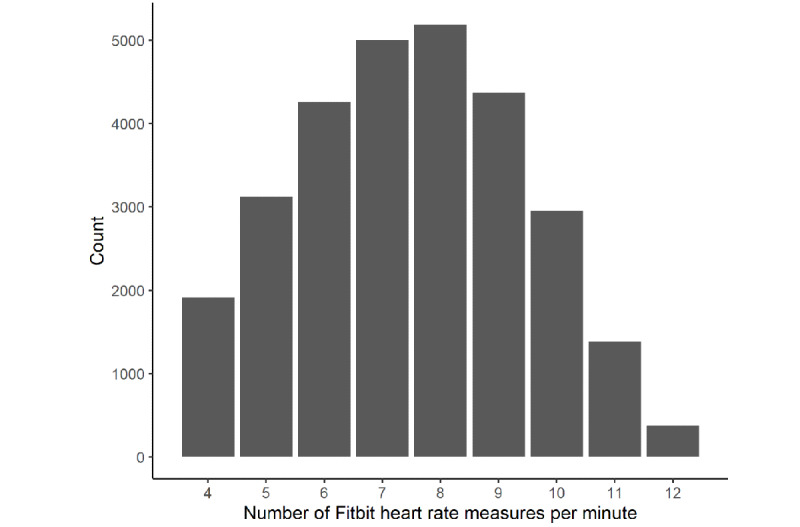
Figure 3.

The available data of all nights (n=59) were extracted and counted for the number of heart rate measures contained. A total of roughly 28,320 minutes (corresponding to 59 study participants who, on average, spent 8×60 minutes asleep) were expected. In fact, 28,601 individual minutes of data were recorded; this figure displays the distribution of all heart rate measures, yielding an average of 7.48 measures per minute. Count data for >12 measures per minute and <4 measures per minute are not displayed because their occurrences were so small that they are not visible on the plot.
