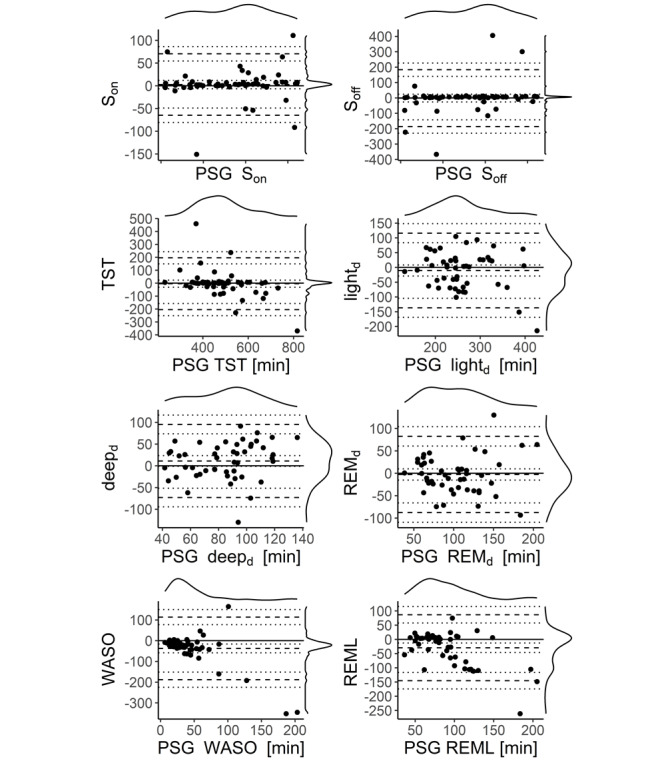
Figure 5.

Bland-Altman plots for various sleep variables are shown with sleep onset defined as the first occurrence of N1. The dashed lines denote lower limits of agreement, bias, and upper limits of agreement. The dotted lines are the respective 95% CI of limits of agreement. On the top and right of each panel, the marginal densities are plotted. The x-axis displays the PSG variables, and the y-axis denotes the differences between the two devices (PSG-Fitbit). N1-derived sleep onset is unbiased. Sleep offset, total sleep time, light sleep or N1+N2 sleep duration, deep sleep or N3 sleep duration, and REMd do not have significant bias. WASO and REML display a significant deviation of the difference between the devices from 0. deepd: deep sleep duration; lightd: light sleep duration; PSG: polysomnography; REMd: rapid eye movement sleep duration; REML: rapid eye movement sleep latency; Soff: sleep offset; Son: sleep onset; TST: total sleep time; WASO: wake after sleep onset.
