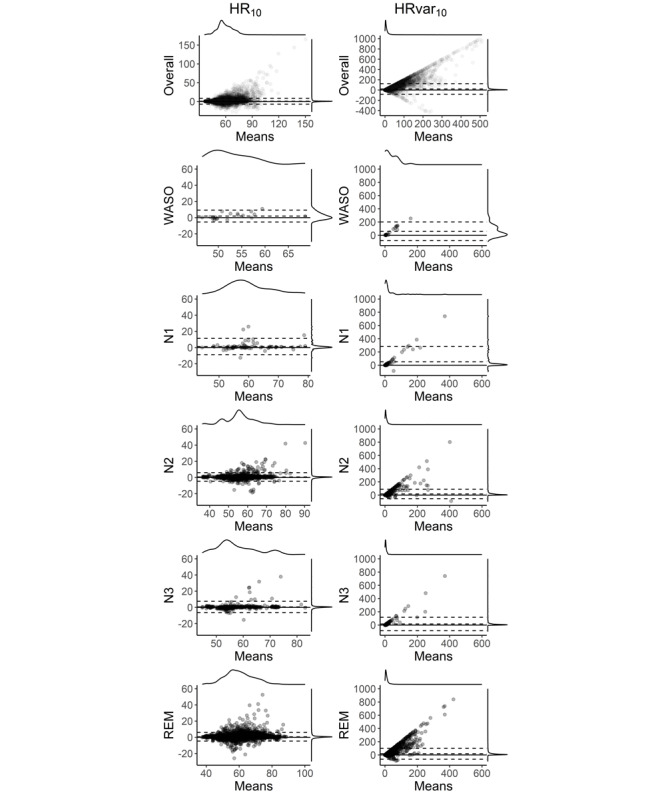
Figure 6.

Bland-Altman plots for heart rate–derived variables. The dashed lines denote lower limits of agreement, bias, and upper limits of agreement for a mixed model dealing with the repeated measures. On the top and right of each panel are the marginal densities. The x-axis displays the means of both devices (ie, [polysomnography + Fitbit]/2), and the y-axis denotes the differences between the two devices (polysomnography-Fitbit). Overall average 10%-trimmed heart rate and 10%-trimmed heart rate variance values are calculated for 1-minute intervals between 30 minutes before sleep onset with N1 criteria and 30 minutes after sleep offset. All other variables are calculated between sleep onset and sleep offset, only extracting the designated variable, in 1-minute intervals. HR10: 10%-trimmed heart rate average; HRvar10: 10%-trimmed heart rate variance average; REM: rapid eye movement; WASO: wake after sleep onset.
