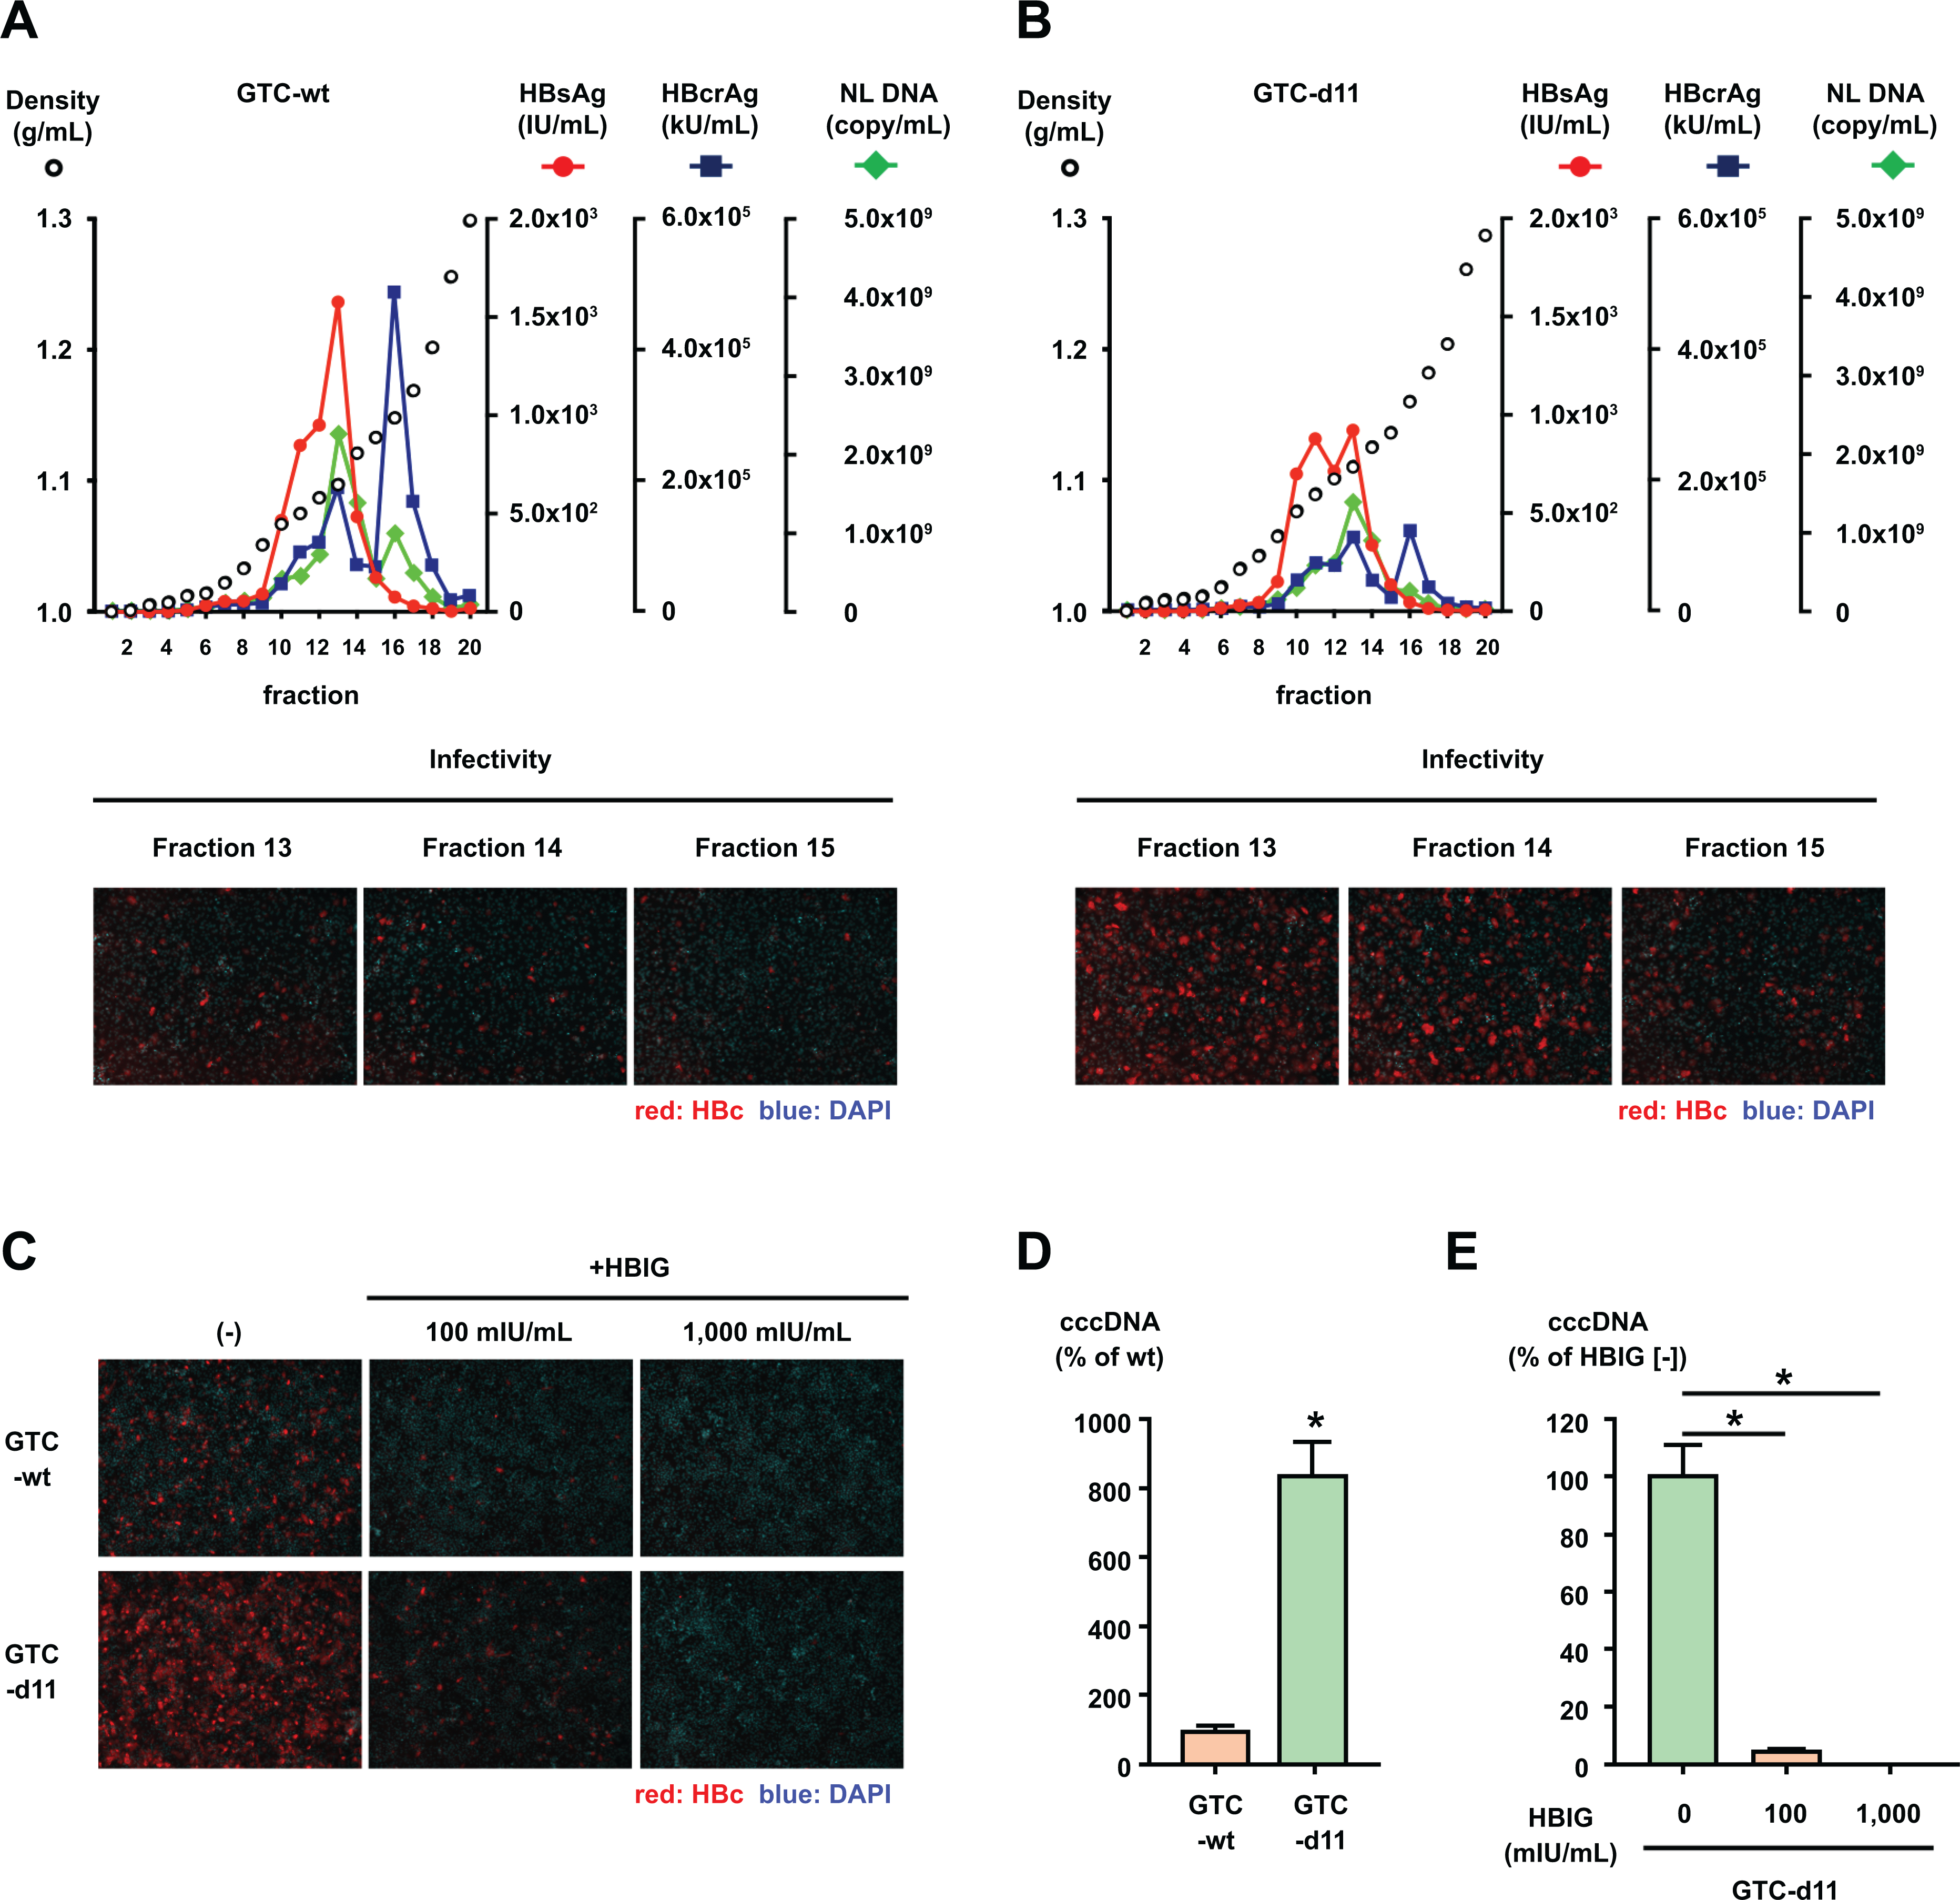
Figure 2. Iodixanol density gradient analysis of HBVcc.

(A, B) HBVcc of GTC-wt and GTC-d11 were purified by a heparin column and analyzed by an iodixanol density gradient. The titers of HBsAg and HBcrAg were measured in each fraction, and the HBV DNA was quantified by real-time PCR after treatment with DNase. The infectivity of HBVcc in the indicated fractions was also evaluated by inoculation of the same volume of fractions onto HepG2/NTCP-C4 cells. (C) The same amount of HBVcc (500 GEq/mL) in fraction 14 of each gradient of GTC-wt and GTC-d11 was mixed with HBIG at the indicated concentrations and inoculated onto HepG2/NTCP-C4 cells. HBV-positive cells were visualized by staining with an anti-HBc antibody, and nuclei were visualized by DAPI. (D) Cell culture-generated viruses of GTC-wt and GTC-d11 were inoculated onto HepG2/NTCP-C4 cells. Synthesized cccDNA in infected cells was extracted by the Hirt extraction method and quantified by cccDNA-specific real-time PCR. (E) The cell culture-generated GTC-d11 virus was treated with HBIG at the indicated concentrations and inoculated onto HepG2/NTCP-C4 cells. The cccDNA in HBV-infected cells was measured by cccDNA-specific real-time PCR after the Hirt extraction method. The data are indicated as the mean ± standard deviation of the triplicate assay. Asterisk indicates a significant difference (p < 0.05).
