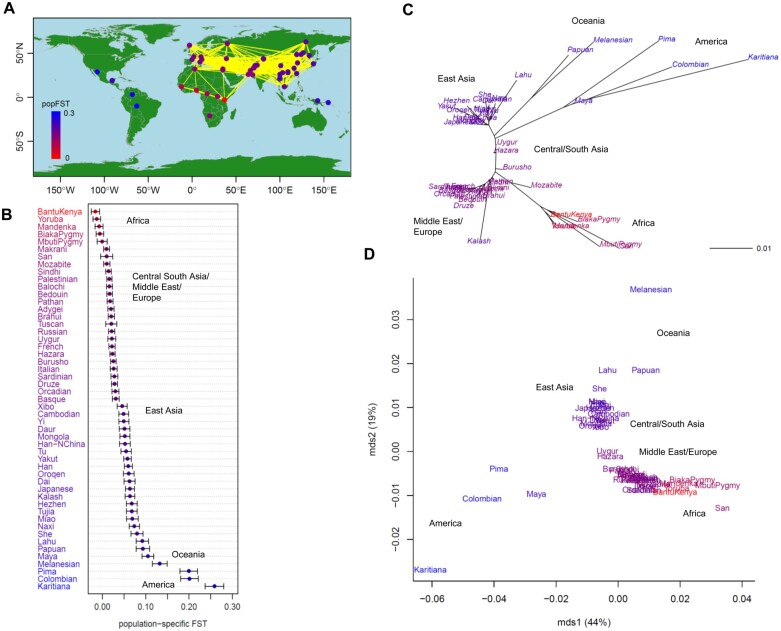
Figure 2.
Population structure of 51 human populations (n = 1035; 377 microsatellites). (A) Map showing population connectivity with the magnitude of population-specific FST values. Populations connected by yellow lines are those with pairwise FST < 0.02. (B) Distribution of population-specific FST values ± 2×SE. (C) Neighbor-joining (NJ) unrooted tree and (D) multi-dimensional scaling (MDS) based on pairwise FST overlaid with population-specific FST values on population labels. The color of each population indicates the magnitude of population-specific FST values between red (for the smallest FST) and blue (for the largest FST).

