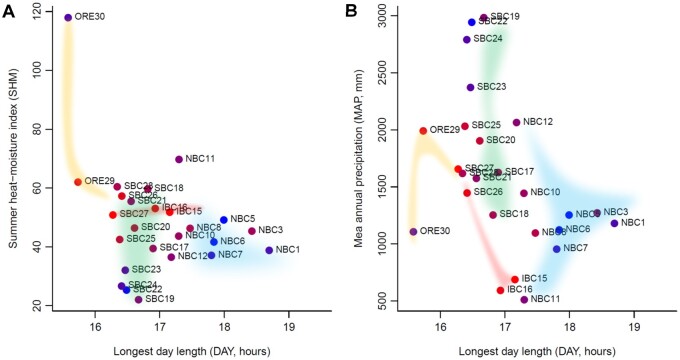
Figure 6.
Population range expansion and key environmental variables. Longest day length vs (A) summer heat-moisture index and (B) mean annual precipitation for 25 geographical samples of wild poplar. The colored areas by the population clusters (see Supplementary Figure S8) show the inferred population expansion from IBC15, IBC16, and SBC27. The color of each population shows the magnitude of population-specific FST values between red (for the smallest FST) and blue (for the largest FST).

