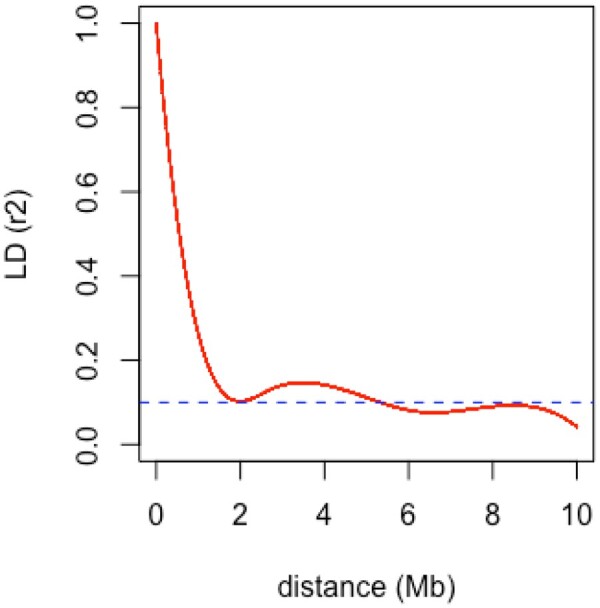
Figure 2.

Linkage disequilibrium (LD) decay estimated in the potato genotypes. Pearson correlation coefficient (r2) was plotted against the physical map distance (Mb) between pairs of SNP. The red line is a regression spline fitted on the 90th percentile and the blue dotted line indicates the r2 value of 0.1.
