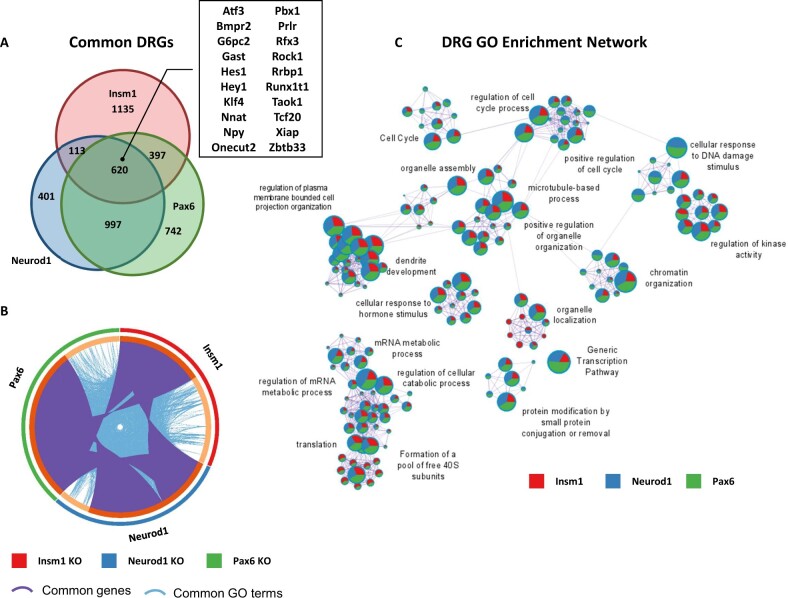
Figure 4.
Enriched GO terms and pathways common for genes downregulated in Insm1, Neurod1, and Pax6 KO pancreatic endocrine cells. (A) Venn diagram shows overlap between downregulated genes (DRGs) (P-value < 0.05 cutoff) in each of the pairwise comparisons: Insm1 KO, Neurod1 KO, and Pax6-KO versus Insm1+/− datasets. A subset of commonly downregulated genes is highlighted within a boxed insert. (B) Circos plot representing genes (purple curves) and GO terms/pathways (blue curves) that are shared between DRGs from the three comparisons. (C) Network depiction of the enriched gene ontology terms shared between DRGs from the three comparisons. Node size is proportional to the number of genes in GO or pathway category, with pie charts indicating a proportion of genes from each comparison in that GO term. Metascape analyses were run using default parameters.

