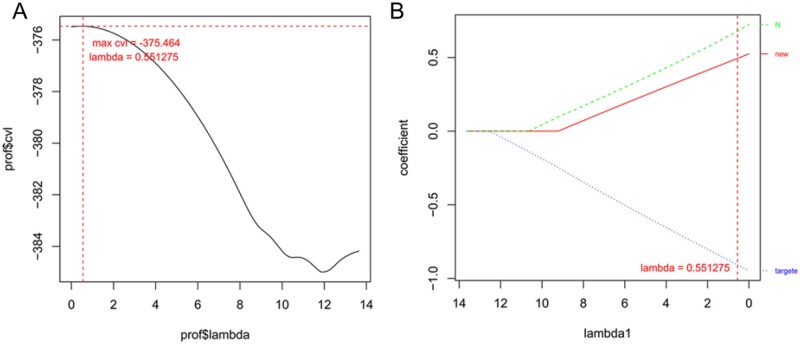
Figure 4.
Risk model construction based on optimal genes and clinical factors. (A) Curve for lambda parameter based on cross-validation likelihood (cvl) screening. Horizontal and vertical axes represent different values for lambda and cvl, respectively, and red dotted line indicates lambda = 0.55 when the cvl = −375.46. (B) Distribution of coefficients for prognosis-related clinical factors based on Cox-PH model of the L1–penalized regularized algorithm.

