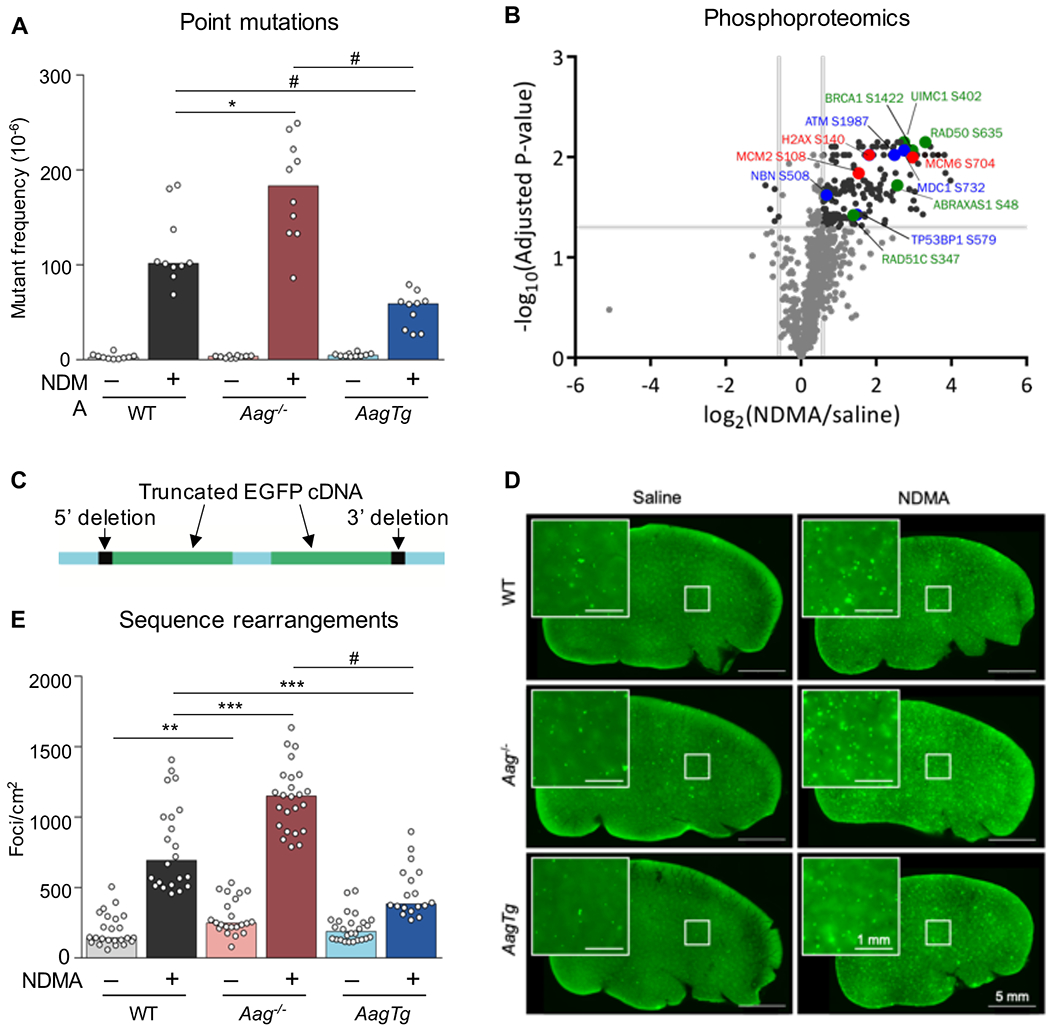
Figure 1. Aag expression levels modulate NDMA-induced point mutations, phosphoproteomic responses, and homologous recombination-driven sequence rearrangements.

A) At 10 weeks after exposure, point mutations induced by NDMA were detected in the liver. Mann-Whitney U-test, *p < 0.05, #p < 0.0001, n = 10 per group. B) NDMA treatment induces phosphorylation of proteins involved in DSB recognition (blue font), replication stress (red), and HR (green) 24h post-exposure. Volcano plot of phosphorylation sites quantified from ATM/ATR substrate motif specific (phospho-SQ/TQ) proteomic analysis in WT mouse livers treated with saline (n = 2) or NDMA (n = 3). Log2 fold changes are relative to saline control. P-values were calculated based on two-tailed Student’s t-test and were corrected for multiple hypothesis testing based on Benjamini-Hochberg FDR correction. See also Table S1. C) The RaDR transgenic construct consists of a direct repeat of two EGFP expression cassettes, wherein the 5’ cDNA has been truncated at the 5’ end and the 3’ cDNA has been truncated at the 3’ end. See also Figure S7. D) Representative RaDR liver images from each group, 10 months post-exposure. Large image scale bar = 5 mm, inset scale bar = 1 mm. See also Figure S3. E) NDMA induces sequence rearrangement mutations detected 10 weeks post-exposure. WT saline n = 24; WT NDMA n = 22; Aag−/− saline n = 22; Aag−/− NDMA n = 24; AagTg saline n = 26; AagTg NDMA = 18. See also Figures S2 and S4. Bar graphs show the median with data points representing individual animals. Mann-Whitney U-test, **p < 0.01, ***p < 0.001, #p < 0.0001.
