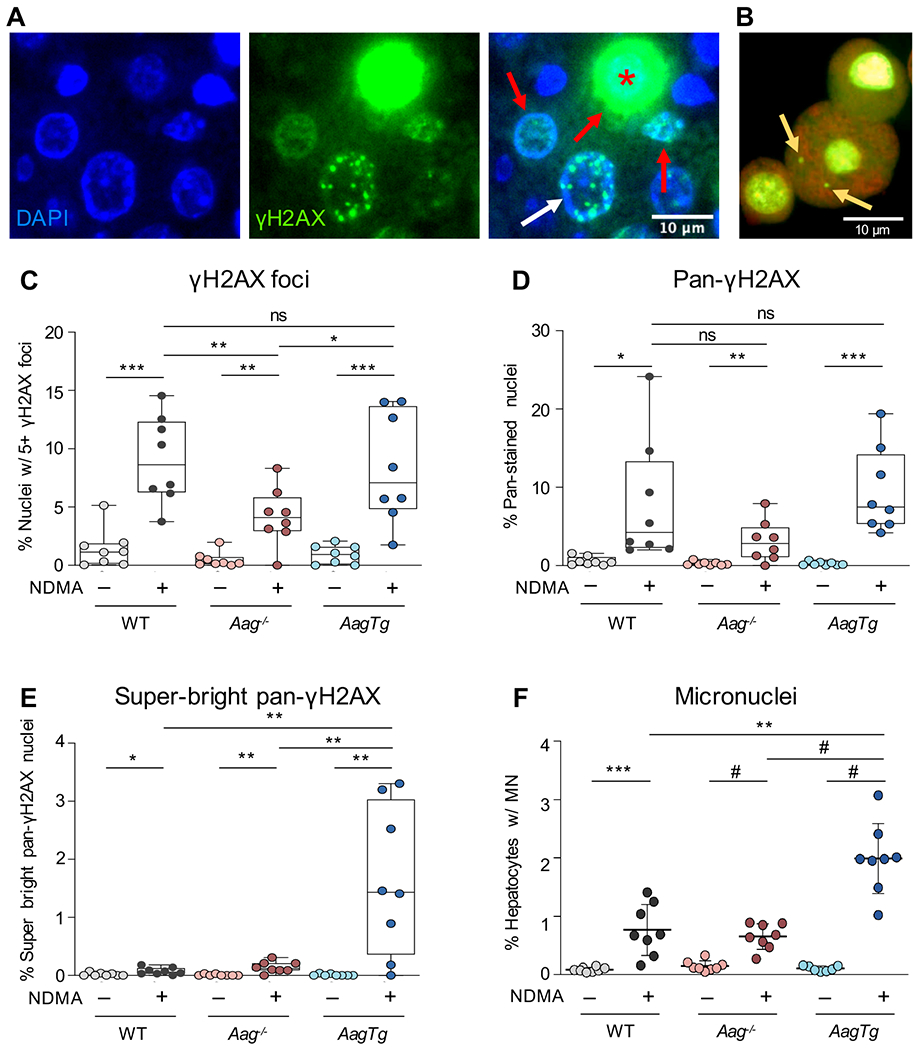
Figure 2. AAG levels modulate NDMA-induced phosphorylation of H2AX and micronuclei.

A) Staining of γH2AX in NDMA-treated livers can appear as punctate foci (white arrow), pan-nuclear (red arrows) or super-bright pan-nuclear (red asterisk). Scale bar = 10 μm. B) Example of a hepatocyte with two micronuclei (yellow arrows). Image adapted from (Avlasevich et al., 2018) with permission from the authors and publisher. C) NDMA exposure increases the number of cells harboring an increase in punctate γH2AX foci 24h post-exposure. Nuclei containing 5 or more foci were counted as γH2AX-positive. D) NDMA increases the frequency of cells with pan-nuclear γH2AX signal 24h post-exposure. E) NDMA increases the frequency of super-bright pan-nuclear γH2AX stained cells 24h post-exposure. F) NDMA induces micronucleus formation in hepatocytes 48h post-exposure. See also Figure S5. Box plots show median with interquartile range, and whiskers show the range. Micronuclei represented as mean ± SD. For all graphs, each data point represents one mouse (n = 8), and γH2AX data points are averaged from two independent regions of one slide. Unpaired Student’s t-test; *p < 0.05, **p < 0.01, ***p < 0.001, #p < 0.0001.
