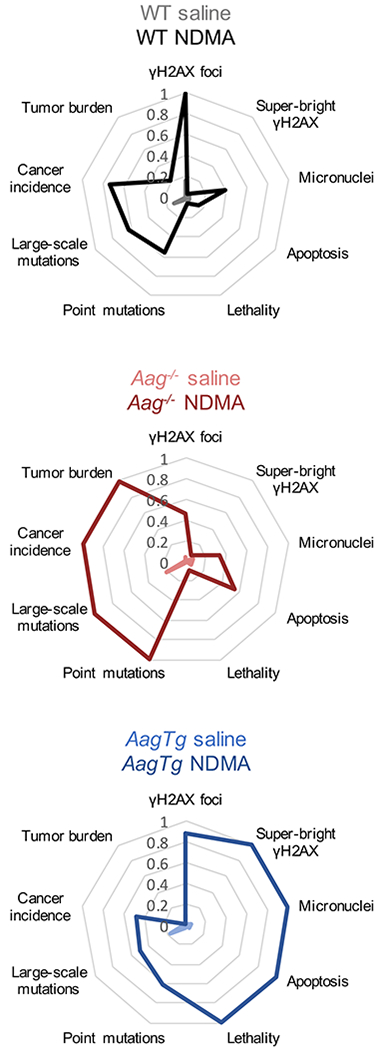
Figure 5. Integration of phenotypic endpoints over time shows that reduced toxicity and increased mutations lie upstream of cancer in Aag−/− mice, and DNA damage and cytotoxicity precede lethality in AagTg mice.

Radar plots showing key endpoints from this study in chronological order. Medians or means from each group for each endpoint are normalized to the highest scoring group at that endpoint (e.g., NDMA-treated Aag−/− mice have the highest tumor burden, so medians of all groups were normalized to the median Aag−/−. Similarly, NDMA-treated AagTg mice showed the highest micronucleus induction, so means of MN results were normalized to the AagTg mean.)
