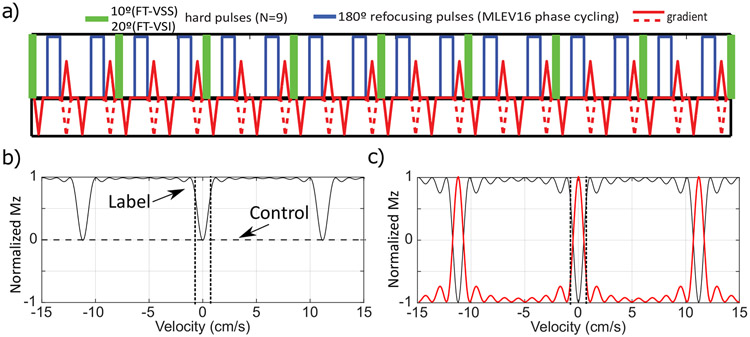
Figure 1.
a) Diagram of Fourier-Transform based velocity-selective saturation (FT-VSS) and inversion (FT-VSI) pulse trains. b) Mz-velocity response for FT-VSS. The horizontal dashed line illustrates the universal saturation response of the control module. The VCUTOFFs at ±0.7 cm/s are indicated by the vertical dotted lines. c) Mz-velocity response for FT-VSI alone (black) and the flipped one after a following non-selective inversion (NSI) pulse (red).

