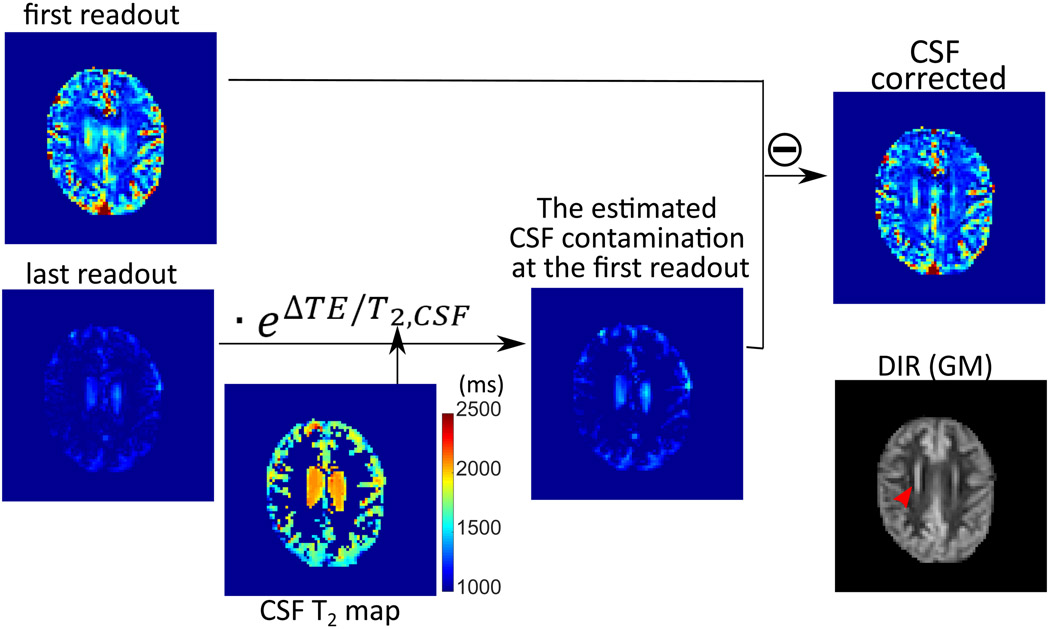
Figure 5.
Example of the process for removing CSF contamination following Eq. [2], using the label-control difference images for the CBV protocol acquired at first and last readouts . The corresponding DIR (GM) image is also shown for comparison. Note the signal of the periventricular gray matter (red arrow in DIR image), which cannot be distinguished from ventricular CSF signal in the CBV-weighted image (first readout), can be correctly represented after the CSF correction.

