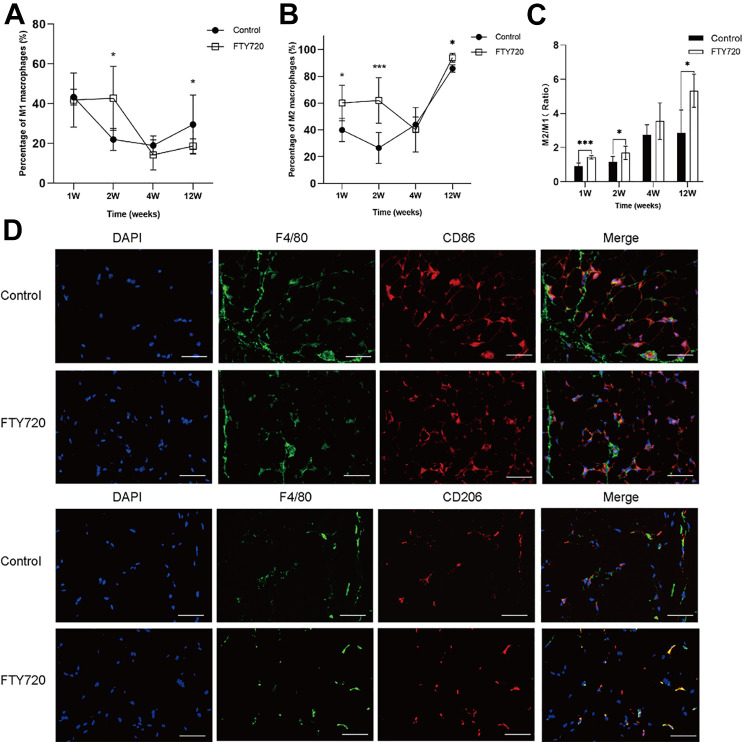
Figure 3.
FTY720 promoted the polarization of M2 macrophages in vivo. The percentage of M1 macrophages (A) and M2 macrophages (B) in CD45+ lymphocytes of fat grafts in the control and FTY720 group at week1, 2, 4, and 12, detected by FCM. (C) The according to M2/M1 ratio of fat grafts in control and FTY720 group. (D) The expression and location of M1 macrophage markers (F4/80 and CD86) and M2 macrophage markers (F4/80 and CD206) in control and FTY720 group at week 12, by IF. Scale bars = 60 µm.

