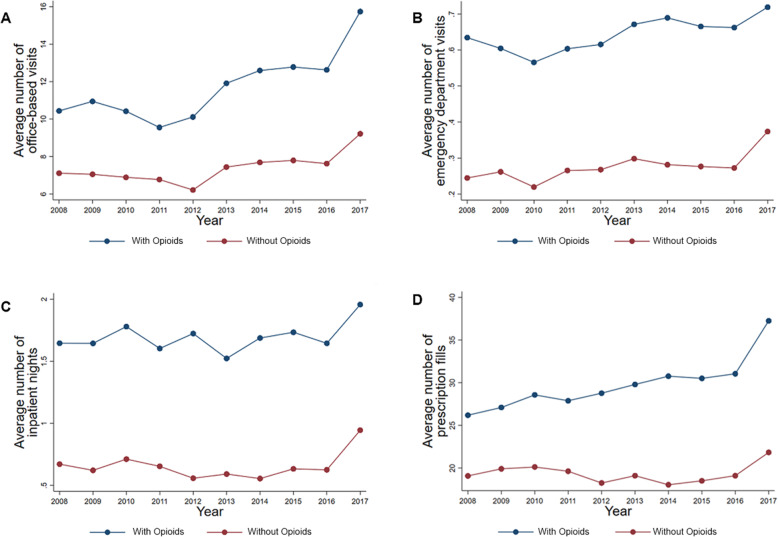
Fig. 2.
The 10-year trends for healthcare resources used for respondents with and without an opioid prescription. Average number of office-based visits for respondents with and without an opioid prescription (A). Average number of emergency department visits for respondents with and without an opioid prescription (B). Average number of inpatient nights for respondents with and without an opioid prescription (C). Average number of prescription fills for respondents with and without an opioid prescription (D). Respondents with an opioid were defined as a household respondent who reporting having been prescribed an opioid prescription on the MEPS Prescription Medicines file

