Fig. 2.
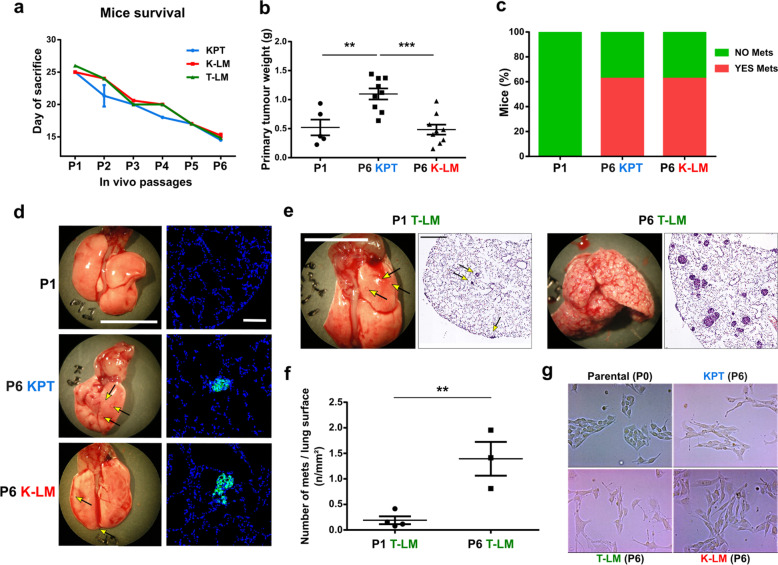
Enhanced cancer cell aggressiveness and metastatic potential of P6 cell lines. a Graph shows reduced mice survival, represented as time between day of cell implantation and day of sacrifice for reaching ethical endpoint(s), during cycles of GFP-RENCA implantation-extraction. b Dots graph shows the weight of primary tumors generated by P6 KPT or K-LM cells, compared to P1, 15 days after orthotopic implantation. c Bars graph showing the percentage of mice presenting, at the moment of sacrifice, visible metastases in the lungs, upon injection of late passaged GFP-RENCA (either P6 KPT or P6 K-LM) compared to orthotopically implanted P1 cell lines. d On the left (scale bar = 1 cm), representative pictures of visible lung metastases deriving from primary tumors generated by P1 or late passaged P6 KPT and K-LM cell lines. On the right (scale bar = 100 μm), representative immunofluorescent images showing GFP-positive lung metastases. e Representative pictures of lungs at the moment of sacrifice (scale bar, 1 cm) and hematoxylin-eosin staining (scale bar, 1 mm) of lungs bearing metastases formed after 15 days from P1 versus P6 cells that were injected into tail vein (i.e. T-LM cell lines). f Number of metastases, per lung surface, generated by T-LM P6 cells, compared to P1, in tail vein injected mice. g Light microscopy images showing difference in mode of growth of P0 versus P6 cell lines grown in 2D-culture. Arrows indicate the presence of metastases on lung surface. Data are represented as mean ± SEM

