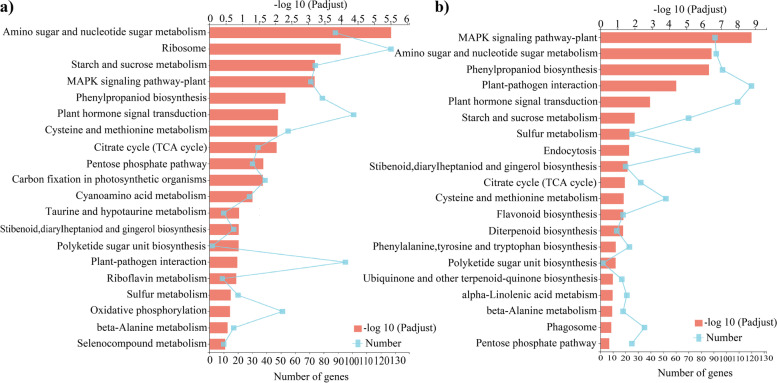
Fig. 7.
KEGG enrichment analysis of genes during Moso bamboo shoot growth and development a KEGG enrichment analysis of genes expressed in the top part of bamboo shoots. b KEGG enrichment analysis of genes expressed in the basal part of bamboo shoots. The vertical axis represents the KEGG pathways. The upper horizontal axis represents the number of genes aligned to a pathway, corresponding to the different points on the broken line. The lower horizontal axis represents the enrichment significance, corresponding to the lengths of the column. The lower the FDR is and the higher the -log10 (padjust) value is, the more significant the enrichment of the KEGG pathway

