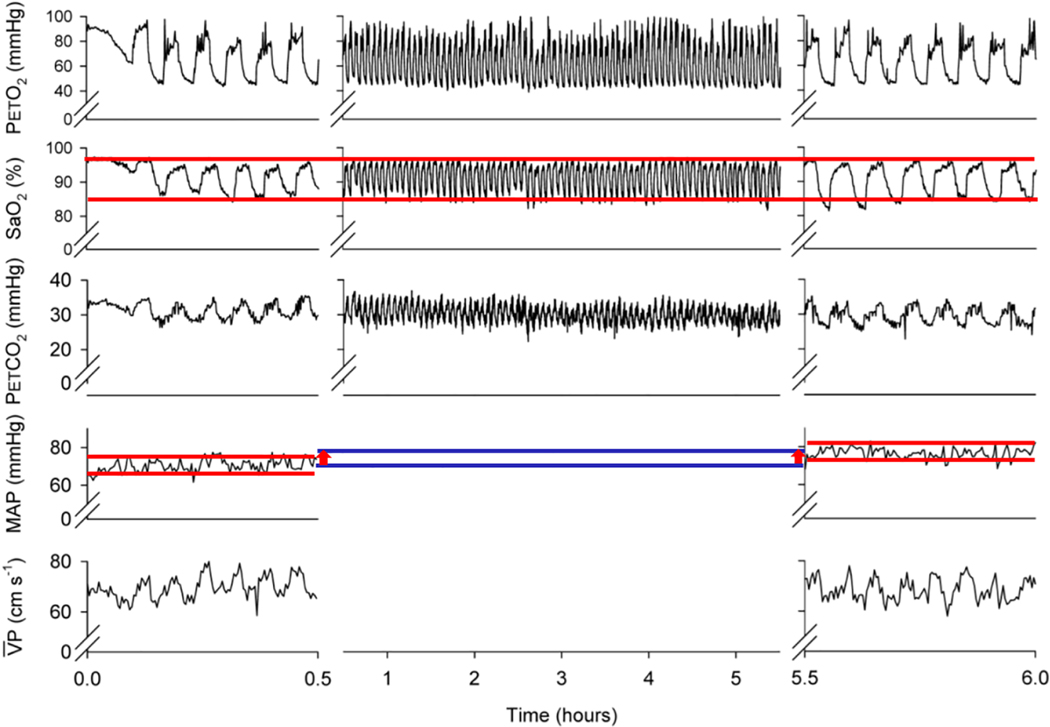
Fig. 7.
Example of a 6 h exposure to intermittent hypoxia in a single subject. Left panel displays the first 30 min of intermittent hypoxia. The middle panel shows the following 5 h of exposure and the right panel displays the final 30 min of exposure. Note that the blood pressure response to hypoxia was greater at the end compared to the beginning of the protocol, despite a similar level of hypoxia. The traces from top to bottom are: end-tidal partial pressure of oxygen (PETO2), arterial oxyhemoglobin saturation (SaO2), end-tidal partial pressure of carbon dioxide (PETCO2), mean arterial pressure (MAP), and middle cerebral artery peak blood flow velocity (VP). The red lines indicate the upper and lower bounds of mean arterial pressure during baseline and then after 6 h of intermittent hypoxia. The blue lines with red arrows indicate the upward shift in mean arterial pressure that is occurring during the 6 h of intermittent hypoxia. The red lines for oxygen saturation show similar degrees of oxygen saturation throughout the study. Also note, in this figure cerebral blood flow velocity did not change. Reprinted with permission from “Cardiovascular and cerebrovascular responses to acute hypoxia following exposure to intermittent hypoxia in healthy humans” by G.E. Foster et al. J. Physiol. 587:3287–3299, 2009.

