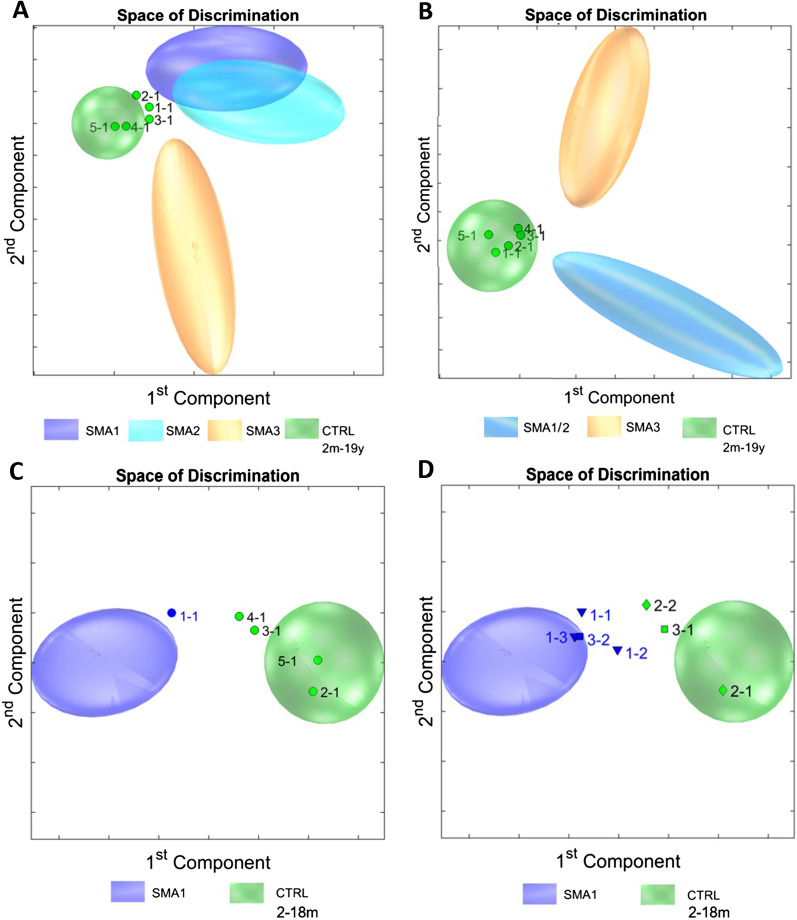
Fig. 6.
Prediction of disease severity in pre-symptomatic SMA. A Spectroscopic fingerprints of five pre-symptomatic SMA samples (determined as 1-1, 2-1, 3-1, 4-1, and 5-1) in comparison to SMA 1, SMA 2, SMA 3 and controls between 2 months and 19 years were consistent with the control group. B Comparison of pre-symptomatic SMA vs. early symptomatic SMA (SMA 1/2), late symptomatic SMA (SMA 3) and controls between 2 and 19 years returned similar results. C Age-matched comparison with SMA 1 and healthy controls between 2 and 18 months reveals a borderline fingerprint of patient SMA001 (1-1) showing some similarities to the SMA 1 profile. D Interestingly, follow-up urine samples from patient SMA001 after 6 months (1-2) and after 8 months (1-3), as well as a follow-up urine sample of patient SMA003 (3-1) after 4 months (3-2) confirm high similarities with the SMA 1 group. No changes were observed on a follow-up urinary sample of patient SMA002 (2-1) after 2.5 months (2-2). SMA: spinal muscular atrophy. CTRL: control

