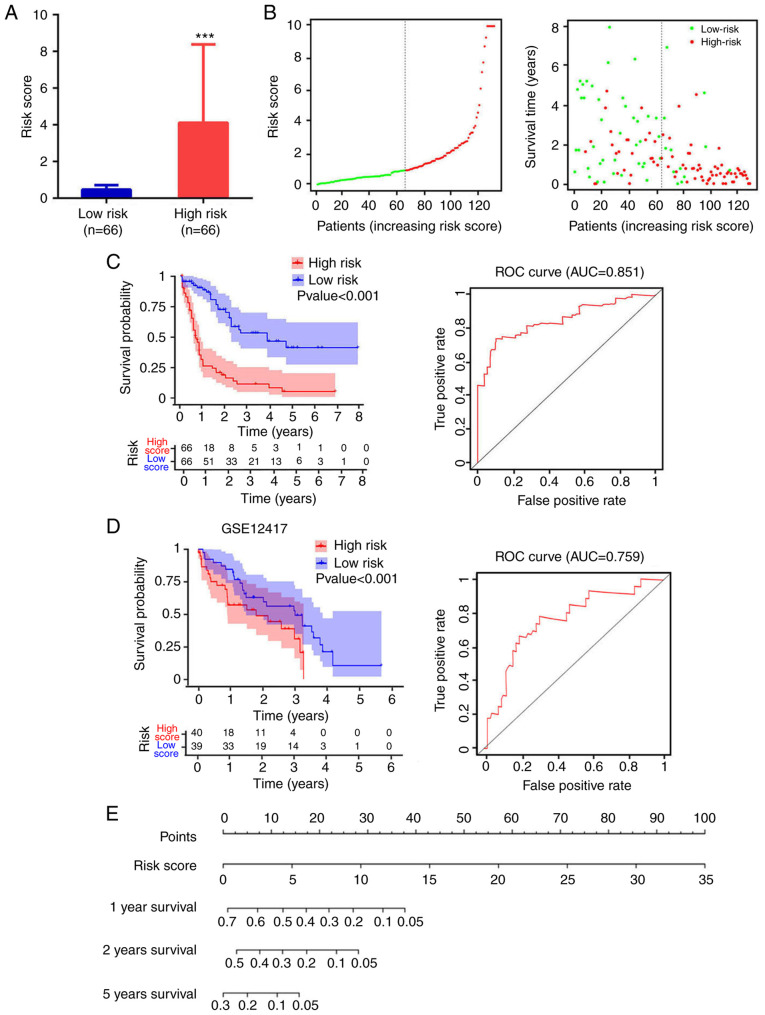
Figure 4.
Analysis of risk score distribution and survival time using a prediction model based on four mRNA molecules. (A) Number of low-risk or high-risk patients (left). Risk score of low- or high-risk patients (right). ***P<0.001. (B) Distribution of the risk score (left). Patient survival time and risk score (right). The black dotted line represents the optimum cut-off point dividing patients into low- and high-risk groups. (C) Kaplan-Meier curves for high- and low-risk groups in TCGA data (left). ROC curves with AUCs for overall survival constructed with high- and low-risk groups (right). (D) Kaplan-Meier curves for high- and low-risk groups in GSE12417 (left). Low-risk group, n=40; high-risk group, n=39. ROC curves with AUCs for overall survival in the high- and low-risk groups (right). (E) Nomogram-based risk scores from TCGA data. Nomogram predicted the 1-year, 2-year and 5-year OS for AML patients. The nomogram summed the points identified on the scale for risk scores in different AML patients. The points projected on the bottom scales indicate the probabilities of 1-year, 2-year and 5-year OS for AML patients. ROC, receiver operating characteristic; AUC, area under the curve; TCGA, The Cancer Genome Atlas.

