
Fig. 3.
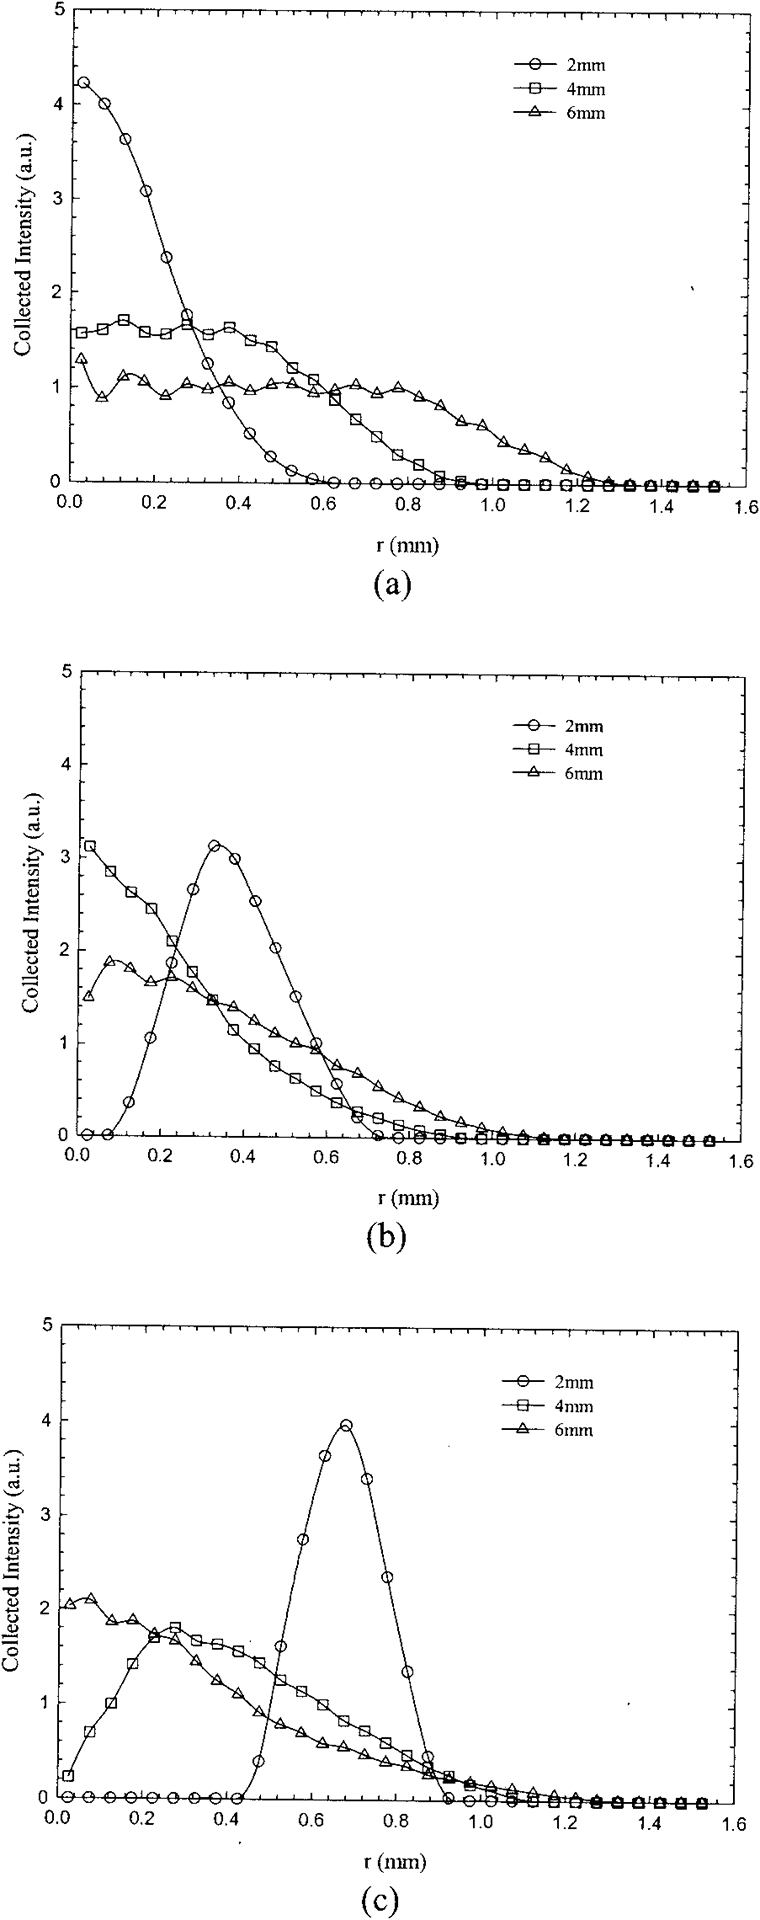
Monte Carlo simulations showing the fluence distribution of the collected diffuse signal (Lambertian target) for (a) the single fiber and probes (b) P2 and (c) P3. Each data set was binned into 0.05-mm radial bins, normalized by the area of each ring, and finally adjusted to unit area under the curve. The extent of the area seen by the collection fibers is shown for PTDs of 2, 4, and 6 mm.