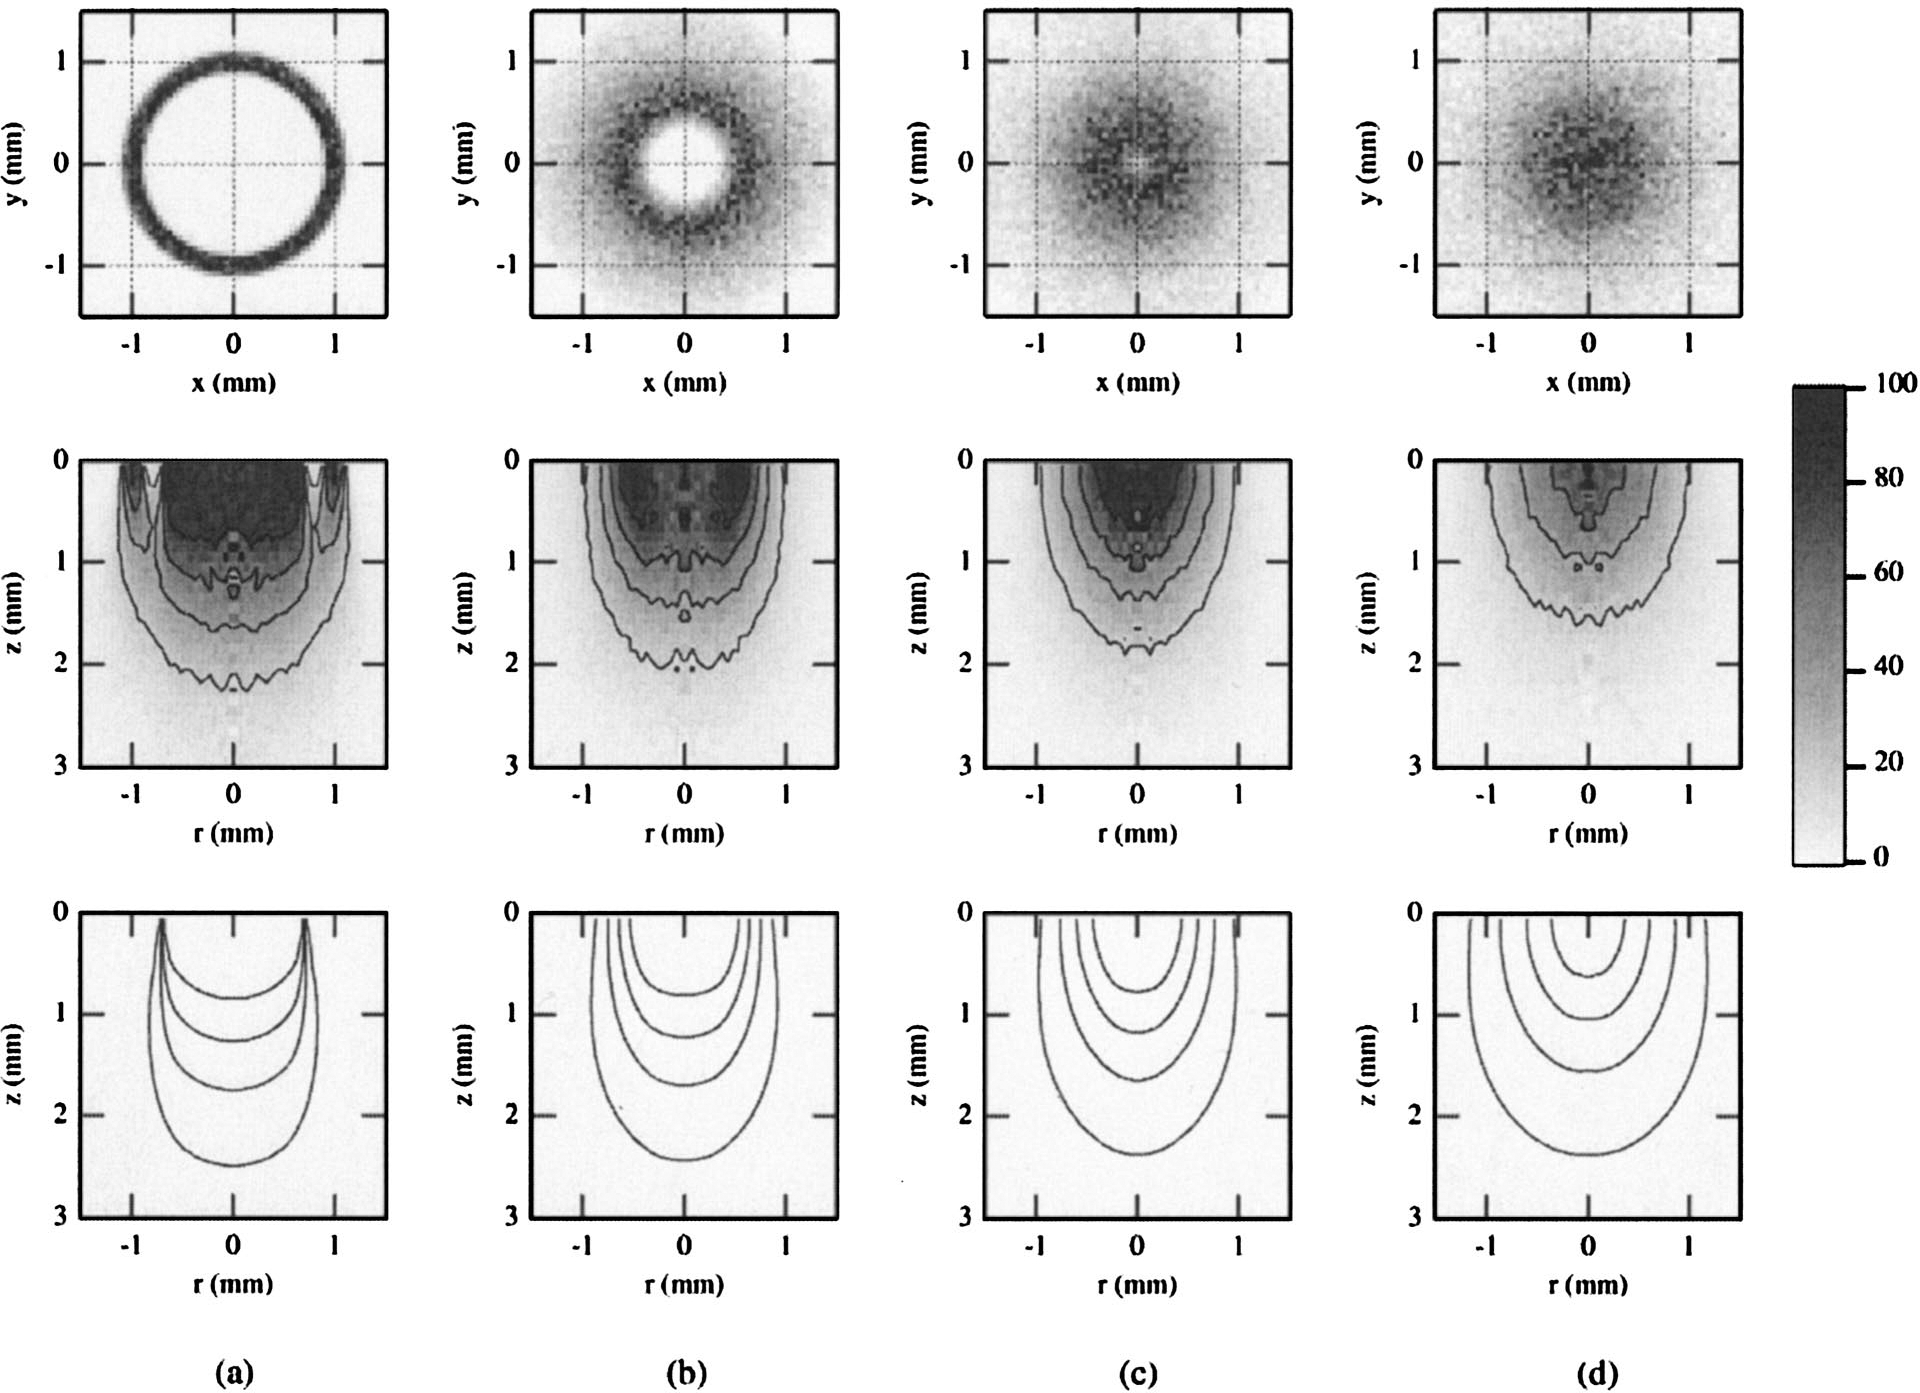
Fig. 7.

Simulations for bifurcated probe P3 and the agar phantom, showing the internal fluence distributions of all photons entering the medium (bottom, illumination volume) and all diffuse photons collected by the fiber (middle, sampling volume). Surface distributions for the sampling volume are shown at the top. Results are for PTDs of (a) 0.1, (b) 2.5, (c) 4, and (d) 7 mm. Contours represent isofluence lines in joules per square centimeter. Data are normalized to the maximum value, with the contours representing 20–80% of this value in increments of 20%.
